Make infographics online with Prezi

An engaging infographic is all about how you visualize and design your data. Use Prezi’s library of beautiful and interactive infographic templates, images, and graphs to create an infographic that keeps your team informed. Share your infographics on social media or send a link to your customers, prospects, and partners for data they won’t forget.

Let's talk!

1-844-773-9449
8:30 am–5 pm PST

video message


Trusted by business both large and small


Interactive data in infographics
Make data more engaging with interactive charts

Your infographic doesn’t have to stay static and flat. With Prezi Design, you can create custom charts, tables, and maps that audiences can interact with. All while maintaining the look and feel of your design. Watch your charts come to life just by hovering your mouse over them to reveal even more data.


Find the perfect infographic visuals
Find the perfect visuals for your infographic

Discover GIFs, images, icons, and stickers in Prezi’s huge library. Prezi teamed up with Unsplash, Giphy, The Noun Project, and Storyblocks to provide you with a wide range of visuals that are sure to suit your infographic. Have an image or visual of your own? Upload it to Prezi to use anywhere in your infographic.


Your data, your brand

Make sure every infographic is branded with the right logos, colors, and messaging. Set up your brand kit to help automate the infographic-making process.

Learn about Prezi brand kits


How to create an infographic in Prezi
  1. Create a Prezi account and open Prezi Design in your dashboard.
  2. Get started with any of our professionally-designed infographic templates.
  3. Upload your own images, GIFs, and videos, or select visuals directly within Prezi.
  4. Add custom elements like tables, graphs, and maps that add an extra layer of interactivity to your infographic.
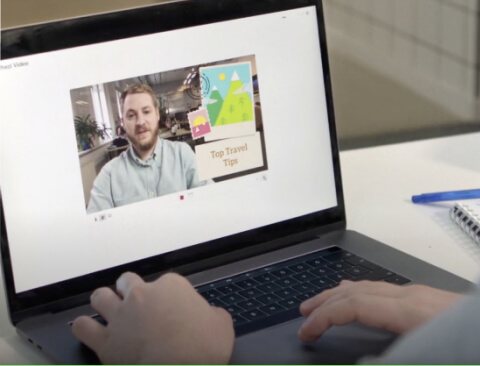
  5. Share your infographic by downloading it, creating a shareable link, or by using Prezi Video to present it on a video call.
 

Create an infographic with Prezi Design


Find the perfect infographic template

Create an infographic that’s both engaging and memorable by starting with one of our Prezi infographic templates. Choose an infographic template, then customize the content with your own data and brand elements.


Get inspired by the best infographics out there

The best infographics are available on Prezi. Look through our gallery of infographic examples, curated by Prezi’s editors, for some of our favorites. Take notes, get inspired, or re-use an existing infographic for your own purposes. Just look for the green symbol, then customize the it with your own content.


More features that make infographics with Prezi great


You’re in the driver’s seat

License management
Add or remove team members, and transfer licenses with ease.

Content ownership
Keep control of your team’s content, even when someone leaves.

Privacy control
Publishing settings and overviews let you manage who sees what.

MSI Installation
Remote software deployment gets everyone the latest versions fast.

We’re your biggest supporters

Phone and chat support
Our customer support experts are standing by to help.

Dedicated success manager
Let your personal guide get your team up and running.

Branded templates
Get your own template with your fonts, logo, and colors.

Advanced training*
Get personalized trainings and webinars, plus the option to get Prezi-certified.

*Available with software commitment minimum

Your security is our priority

SOC2 compliance
We stay compliant and constantly up-to-date with SOC2 requirements.

Continuous monitoring
We constantly scan and test our infrastructure and application.

Cross-team integration
Our security, engineering, and product teams partner with each other closely.

Learn more about our security measures


Frequently asked questions


What is an infographic?

An infographic is a visual representation of a story using minimal text. It uses imagery and data visualizations, such as tables and graphs, to make the information easy to digest. Because of their ease of use and ability to grab the attention of large audiences, they’re great to share on social media.


What should an infographic contain?

An infographic should have:

  • An eye-catching, intuitive design
  • Data visualizations in the form of graphs, charts, maps, and tables
  • Imagery such as photos, graphics, and icons


Can I create infographics for free?

Yes. You can use Prezi Basic to create an infographic or any other kind of design for free, or try one of our more advanced plans with even more features.


Can I edit my infographic after I publish it?

You sure can. Update any infographic in your dashboard at any time. This is a great option for those who want to update their infographics on an ongoing basis.


How do I share my infographic?

There are plenty of options for sharing your infographics on Prezi. Download your infographic as a PNG or PDF file, or create a link and share it to your team that way. You can also take your infographic to any virtual meeting and display your data next to you on screen with Prezi Video.


Learn more about creating infographics


Data visualization is better with Prezi

Prezi helps you create engaging, stunning infographics that are perfect for virtual and hybrid working environments. See for yourself – discover other cool features when you get a demo or sign up for a free trial.