Make your key metrics, company goals, and performance reports more engaging than ever with interactive reporting tools from Prezi.
1-844-773-9449
8:30 am–5 pm PST


Reporting is not just about gathering data and putting it into a bulleted list. Create interactive reports in Prezi with impactful animations and graphics to capture the attention of your audience, keep them engaged, and focus on what's really important.

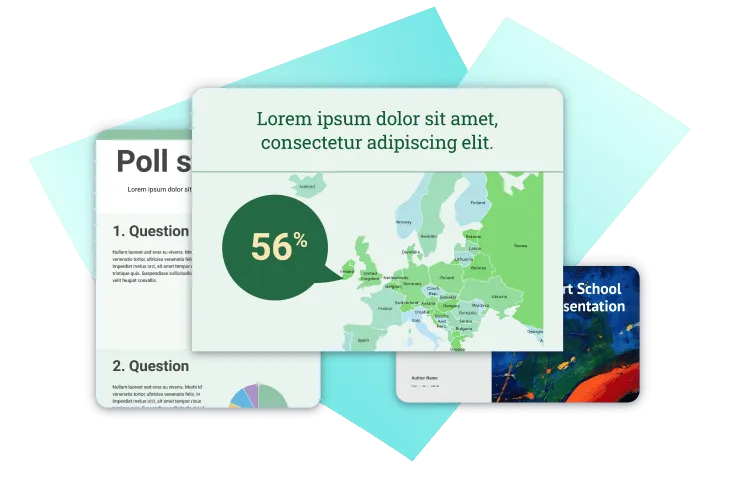
Explain complex ideas with easy-to-read charts and graphs of all kinds: Present geographic data in the form of interactive maps; add extra context with tooltips and callouts; or supplement reports with images, videos, and GIFs. Turn literally any kind of data into a visual story.

Present data seamlessly with interactive reporting tools in Prezi. Build data visualizations in Prezi Design and bring them next to you in live video calls via Prezi Video. Can't make it to the meeting? No problem — download the report, embed it on the web, or record your presentation in Prezi and share the story with your team.

Give your team the quick-start solution for interactive reporting. Easily create branded templates, use our professionally designed templates, or make your own with our intuitive editor. Invite the team to build data visualization projects collaboratively and make the most of it.
Boost your audience engagement by seamlessly connecting Prezi Video with your choice of the most popular video conferencing apps.


License management
Add or remove team members, and transfer licenses with ease.
Content ownership
Keep control of your team’s content, even when someone leaves.
Privacy control
Publishing settings and overviews let you manage who sees what.
MSI Installation
Remote software deployment gets everyone the latest versions fast.

Phone and chat support
Our customer support experts are standing by to help.
Dedicated success manager
Let your personal guide get your team up and running.
Branded templates
Get your own template with your fonts, logo, and colors.
Advanced training*
Get personalized trainings and webinars, plus the option to get Prezi-certified.
*Available with software commitment minimum

SOC2 compliance
We stay compliant and constantly up-to-date with SOC2 requirements.
Continuous monitoring
We constantly scan and test our infrastructure and application.
Cross-team integration
Our security, engineering, and product teams partner with each other closely.
Learn more about our security measures
Interactive reporting is about creating reports that allow users to interact with the data presented, such as accessing more information from tooltips, filtering data, or comparing and sorting different elements. To put it simply, interactive reporting is not static.
Animations, embedded videos, interactive maps, images, videos, and other visual elements make interactive reporting more dynamic, engaging, and easy for the audience to understand.
Interactive reporting is useful in any case where data must be presented in a structured way to a specific audience. Annual company sales, marketing campaign performance, CEO salary indexes, and demographic indicators are just a few of the use cases – interactive reports can be created for pretty much any topic.
You can create an interactive report in Prezi Design in five steps:
See a demo, try out cool features, and learn how Prezi can help make your reports become more engaging and interactive.