Prezi Design’s simple drag-and-drop editor lets anyone make professional-looking charts, reports, maps, infographics, and more, then share them anywhere in any size.
More than 500 templates to choose from!
Tell powerful visual stories in a snap. Even when you can’t be there in person, studies show that graphics are more effective than words alone.
Maps
Charts
Infographics
Reports
Dashboards
Slides
Posters
Email Headers
Social Posts
Custom
Add animated GIFs
Add motion to your designs to keep audiences engaged.
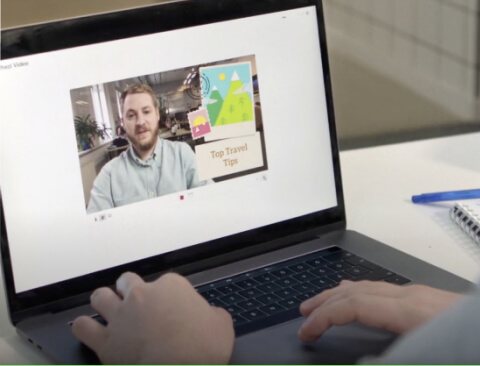
Use video covers
Make your projects come alive with eye-catching video.
Create animated graphs
Grab attention with bar chart races and other dynamic charts.
Zoom, bounce, flip, or fade
Use subtle effects for a seamless and professional look.
Find the perfect visuals
Search top-quality images, videos, GIFs, and illustrations from Unsplash, Giphy, and others.
Upload your own content
Already have the perfect visuals? Upload those, or choose from our massive library.
Add filters and effects
Use our simple, effective tools to create visual effects and adjust contrast, brightness, and more.
Use image masking
Choose patterns or shapes to lay over your image like a stencil, so only parts of it show through.
Create graphs
Visually explain complex ideas with charts and graphs of all kinds.
Insert maps
Add geographic context by using your own, or find what you need in our map library.
Add context
Add tooltips or callouts to explain something or give additional info.
Use data
Import CSV, XLX, and XLXS files, or integrate with MySQL, PostgreSQL, Amazon Redshift, Oracle, and Ms SQL.
Download designs as PDFs and images, or use full-screen mode to share dashboards and slides.
For Web
JPG
High quality
PNG
Print/Vector
Present
Full-screen
Web
Share a link
Media & online publishing
Double engagement and broaden your reach with irresistible infographics, reports, charts, and maps that give your story impact.
Reporting
Make your key metrics, company goals, and projections more engaging than ever with compelling reports, dashboards, and charts.
Nonprofits
Turn your passion into eye-catching visuals that attract and inspire supporters, volunteers, and donors to take action.
Marketing
Create and share data-driven content that simplifies ideas, increases your reach, and boosts your audience engagement.
Government organizations
Keep your community informed and involved through professional-looking interactive reports, infographics, posters, and social media posts.
Education
Engage your students with interactive reports, infographics, maps, and charts that keep them focused and involved.
Ready to empower your team? We are.
Get them started with Prezi today by buying the licenses you need right now.
Want to see Prezi in action? We’ll show you.
Get a demo, try out cool features, learn about our scalable pricing options, and more.