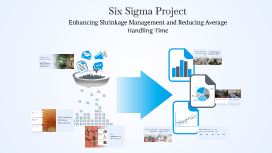
You're about to create your best presentation ever

Six Sigma Project Presentation Template

Create your presentation by reusing one of our great community templates.

six sigma project presentation

Transcript: SIPOC How much is the cost of this problem? The goal of this project is to reduce defect (step) due to ‘protruding’ of seal top inboard and their by improving the yield of the process form 95.2% to 98% with in April, 2013. DMAIC Methodology Statistical Tool used Measure Phase Control Phase Root cause 1:Joggle height is more than specification limit DMAIC Improved Process CONTROL All these issues are contributing to the development of 'step' very close to upper specification at area 'B1' ANOVA - Results Selected solution A: Use of BS L164/L166 sheet metal and ensuring control of joggle depth by supplier. Following continuous variables are measured in this project Control phase ensures that the developed solutions are implemented in the main process and improved process is sustained after the project is closed Thickness of composite box is close to lower specification limit (LSL). Thickness of all the measured ‘seal top’ are out of the specification limit (L164). Thicknesses of the entire measured ‘piece joint’ are out of the specification limit (L164). Variation of joggle height of piece joint (L164) Root cause 3. Thickness of composite box is close to lower specification limit in the area B1. Selected solution A: Manufacturing of Wing part composite box with new material. Cause and effect analysis Improve phase is aimed to develop solutions, select the best solution and implement it with the verified risks. Two project methodologies Normality test Hypothesis test - 2 sample t- test ANOVA Inner joggle height is more than outer joggle height Minimizing development of 'step' by seal top/piece joint inboard in the aileron assembly Selected root causes Verification of root causes Define Phase Process capability at area B1 and B3 (Simulated data) Measurement Protocol Big 'Y' of the project Joggle height (simulated data) DMADV is used for projects aimed at creating new product or process designs. Analyze phase tries to identify root causes of the ‘defect’ by using (data door)statistical tools and process door analysis. Questions? Six Sigma Methodologies About me Similarly, suitable measuring point are identified and measured for other articles. IMPROVE What is defect? The measure phase aims to understand the baseline performance of process by developing measurement system and collecting necessary data of the process. Simulated data DEFINE Thickness is more at ends What is the problem? ANALYZE Thank you all for listening ! •Supplier has confirmed he is using L166, whose thickness varies from 1.5mm to 1.7mm. •Resin flows out from the edges of composite box during curing process, which has lead to thinner area at area B1 and area B3. This root cause is verified with composite production engineer. •Design engineer was not aware of the use of L166 sheet metal for manufacturing of seal top and piece joint. Estimated Goal Measurement Tool used Other solutions What is Define phase focuses only on the problem DMAIC is used for projects aimed at improving an existing business process Analyze Phase Root cause 2. Thickness of seal top is out of tolerance (L164). Selected solution: Use of BS L164 sheet metal and ensuring control of thickness of seal top by supplier. Since week 1 2012, rework levels to get seal top inboard and piece joint within the tolerance limit has increased takt time in the A320 Wing part assembly line. Improve Phase 1.Thickness of composite box 2.Thickness of seal top 3.Thickness of piece joint 4.Joggle height of piece joint 5.‘Step’ after assembling Protruding of seal top inboard more than the specified tolerance limit is defined as defect, i.e if the seal top inboard protrude more than 1mm at the area B1 and B3. Additionally, if seal top inboard protrudes more than 0.5mm at the area B2 is also categorized as defect. Primary observation in Measure phase Six Sigma at Liu MEASURE Masters in Industrial Engineering and Management & Six Sigma Green Belt This problem is demanding an extra work for the whole business value chain from sourcing department to andon team, costing 320 000 SEK/Year. Communication Plan Six Sigma project:

Six Sigma Project

Transcript: y=f(car, electrical tool, mechanical tool, printer, computer , software , paper feeder) Must Have: -Fast, Error free program -Examination (electrical – mechanical ) Tools Good to have: -Web Services to Register Car Information by The car owners before they come. -Scheduling the car test appointment automatically. Nice to have: -Suitable Waiting area for customers. -Portable examination tools with portable program to do test outside. Inputs: Supplier : Goal: Checklist: Increase employees productivity by 70%, increase the organization revenue by 10 million S.R within 6 months. Control Improvement -Car Information -Car -Car -Certificate Y f(x) Print Certificate Six Sigma Project By Nasser, Hatim and Omar In the last year 60% employees of car conformity department complain of low speed program, a lot of error messages appears make difficult to achieve their work at the time, low employee productivity by 40% , decrease in our organization revenue by 25 million S.R Customer : Giving Result to Customer Process SIPOC -Availability of Backup power unit -Employees Attendance -Software System Running -Networks communication Running -Printers Running -Printer Ink and the Papas -Dedicated Technical Support -Check up Tools Problem : outputs: Y=Employees Productivity Enter The result Car Conformity Department in SASO -External Customer: Car owner -Internal Customer: Car technician ( our employees) Sigma Is : -Mechanical Devices Supplier. -Electrical Devices Supplier. -Computer Devices Supplier -Printing Papers Supplier. -Car Owner. DPMO=(NO.OF DEFECTS)/(NO.OF UNITS*No.of opportunities )*1000.000 Entering Car Data Receiving Customer's Car DPMO=575/(17900*2 ) * 1000.000 DPMO=16.061 Sigma = 3.62 Apply Multiple Test

Six Sigma Presentation

Transcript: Questionnaire Explanation of our study (boundaries) - Perceived time - Expected time Errors types: - Not filling the entire questionnaire - Misunderstood the question Measure Explanation of our study (boundaries) Errors types: - confusion with the stopwatch - skipping the starting / ending 3 types of data: -Measured time - Perceived time - Expected time 2.Process control system 2. Implementation in the shop A new environment Solution Selection Matrix Graphics 1.Measurement system and process capability Questionnaire and Chronometer Sellers can feel threatened Point of measure Defect definition General explanation of our study : - In Lysadis Shop - 3 times - 2 per team: 1 for the measure, 1 for the questionnaire Satisfy the clients Offer new selling opportunity Anticipate futures demand Project Scope: All customers Project Boundaries: Starts when the customer enters in the store... ....ends when the employee starts talking to the customers Improvement steps Analyse Phase 2. Specification limits Define Phase WHY ? Customers wait longer A poor visibility of the customer’s location - Wrong orientation of the shelves -A mistake in the signage. 3. Validation of measurement system What is Lysadis ? Designing the physical shop structure Managing the staff Fishbone Diagram The shop's opening CTQ: The customers’ waiting time Business case: Improving the “customer welcoming” process FMEA 3.Closing the DMAIC Poor visibility of the customers by the sellers Stock problems Customer is lost The employee cannot see the customer The customer needs help The next customer’s waiting time The shelves are high and the department’s orientation are inappropriate: The bad management of the supplies It is hardly detectable Happens frequently : no IT gouvernance The severity is medium Ranking the best solutions Control Phase 1. Root causes Improve Phase The employees’ tasks - Inefficient management. -lack or a bad communication 1. Project « Y » Identification Measurement Phase CTQ : «Waiting time for the customer» Measured Time / Expected Time Optimizing the ergonomics The new shop's construction

Six Sigma Project

Transcript: Measurement System 5S Problem Statement 1) Don’t have a standardize way to program and train programmers so they are at the same level 2) No detailed and categorized documentation of bugs so they can properly learn from their mistakes A Connection to ATS B Desktop Page Layout Creation HTML/CSS C Mobile D Other E Browser Compatibility Why were we unable to meet the agreed-upon timeline and target minimum number of bugs per website? 1) It took more time 2) The programmer did a lot of bugs Problem Definition Analysis of Categorical Data DPMO Why didn't we do this? Six Sigma Project: Improving Websites Quality Accurate Repeatable Linear Reproducible Stable Reduce the number of bugs from an average of 12 per website with 2 reaching the client to 1 bug and zero reaching the client Improve Introduction Force Field Analysis Fishbone Diagram DOE Surface Plot 1) Because we were running behind on other projects. 2) We were understaffed 3) No delegation of authority to the operation manager to implement his idea 4) Micro management thus waste of time 5) Bugs: we didn’t have the proper system to categorize all types of bugs 6) Team is in different countries. Control A deviation between what should be happening and what actually is happening Bug Free Website (Focus of the Project) Higher Quality Design and Better Creative and Artistic Execution Conformance problem: unsatisfactory performance Collection of Data Process Control Plan Discrete data: number of bugs, hours worked Manual manipulation using Excel Sample was 33% of population spread over 6 months Judgment Sampling Different Types and Complexity Analyse 2 Bugs per project 0.014 bug per hour of development Critical-to-quality tree SMART: Specific, Measurable, Achievable, Relevant, Time Bounded "From September 2013 to February 2014 the number of bugs encountered was high at about 12 per website. Some were after the website was delivered. That created 5 complaints from different clients of which 2 were at the VP level. In turn, company's image was affected" Why is our client unhappy? Control Charts Designing potential errors out: Training Documentation of errors Identifying potential defects and stopping a process: Optimizely.com Finding defects that enter or leave a process Optimizely.com Cost of conformance: Waste of time to fix bugs and code errors It is happening at the late stages of the project execution. Hence, the cost (which is the time spent) is higher Managers spend valuable time in testing Cost of Poor Quality: 5 bugs reached the client Company's image and reputation in line SIPOC KPI Why the programmer did not code properly? Define Why did it take so much longer? why there were a lot of bugs 1) Complexity of the project 2) Miscommunication 3) programmer not writing code properly : one of the programmer is weaker than the other Control Charts Cost of quality Goal Statement Sort: Everything is well documented. clear. precise. Set in order: Put needed items in their correct place. Better Organized cloud to minimize waste of time and also to find the proper information Shine: No unnecessary files. Standardized cleanup: Optimize the system. Put archive folders. Use TAGging Sustain: Use procedure and proper documentation and follow ups monthly to keep everything in order. DOE - Factors: Developers - Level: Involvement Career Websites Good Design, Company's Image Functional, Practical, Ease of Use Process Map Measure 175,094 DPMO = 2.4 Sigma 0.17 Bugs / Hours New Target = 3.7 Sigma 1 per project or 0.014 Bugs / Hours Training of managers and employees (sending managers to seminars, managers then coach employees) Committing to less projects in order to focus on process improvement. Hence, more time will be available Regular meetings between management and employees to allow for brainstorming Encouraging employees to give feedback so that they are involved in the improvement process U Control Charts to monitor improvements A lot of programming bugs Project took more time then expected Poka-Yoke

Now you can make any subject more engaging and memorable