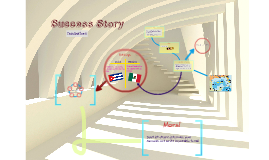
Success Story
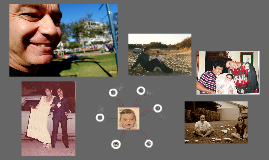
Transcript: Success Traits: My father values working, studying Parents Good life advice Julio Dellasanta Profound Statement: Being offered a job in the U.S Being married for so long (he said chuckling) Being a recognized and respected professional in his field. Family Patient Persistent Studious Honest Sociable and "playing." For as long as I've known him, he has spent day after day doing just that. He works Monday through Saturday (and often Sundays) from 6 to 7, comes home and begins studying about the new airplane he is in charge of fixing, or studying for his next leadership exam. And whenever he has a free moment, all to himself, he sends mom and I out of the house and begins playing his trumpet like he's 12 years old again. Major Influences: Major Life Events: Moving to the United States Marrying my mother The births of his three kids The births of his four grandchildren His Values: My Values: His knee surgery The language barrier I personally value food, happiness, art, consistency, and companionship. Though my values differ from my dad's he embodies what I believe in. {Connection} Bio: Major Obstacles: Julio Dellasanta, was born on December 13, 1956 in Buenos Aires, Argentina, to Luisa Rao and Luis Dellasanta. He spent his early childhood going to school, and playing outdoors. One of his favorite pastimes (and the source of some great anecdotes) was throwing rocks at people from the roof of his house. My father has two siblings, Adriana, who is older than him, and Luis (we call him Tati) who is younger. His "high school" years were spent going to technical school from 8AM to 6PM and learning about mechanics. When he was 20 he marries the Andrea Rico, with whom he recently celebrated his 36th anniversary. He built his own home and ran a body shop for several years, until he began working as an avionics mechanic (which just means he fixes airplanes. In 2003 he relocated to the United States, where he has lived ever since. He works for a small company in Ft. Lauderdale as team leader for a group of wonderful co-workers and friends. "Work hard, play hard." Mom- "Gilera!" Me- "I'm sorry, what?" Mom- "Moto...like Harley Davidson!" Dad- "To find happiness in the simple things in life. By: Juliana Dellasanta Life If you couldn't tell from our names, Julio is my father, and my biggest role model. To me, he is the epitome of success. He comes home every night after sometimes working 18+ hours kisses my mother and gives me a hug as if his day was spent lounging around. You would never know from the smile on his face and the pep in his step that he spent hours moving engines, crawling into airplane ducts and running back and forth from hangar to hangar in 90 degree weather. He does have bad days. Days where he just wants to go straight from work to bed. Days where he doesn't want to talk. But that makes him all the more human and all the more admirable. My father is humble, and knowledgeable and the happiest man I know. If in the future I'm anything like him, I know I'll be successful. Awards/Accomplishments: