You're about to create your best presentation ever

Powerpoint Template Design Services

Create your presentation by reusing a template from our community or transition your PowerPoint deck into a visually compelling Prezi presentation.

Design Services

Transcript: SUBTITLE TEXT HERE Design Morrison Utility Services (MUS) has invested in establishing a dedicated in-house design service for end-to-end water and wastewater networks. The team, which comprises of more than 40 competent engineers and designers, is based in the North of England. The Design Services team carries out a range of activities within the areas of investigation, field services, design and work on projects such as water network rehabilitation, structural pipeline design, civil ancillaries, lining, mains cleaning (shear stress flushing, ice pigging, air scouring/pigging, swabbing) and pressure management. The Design Service team uses the latest hardware technology – drones, GPS, pressure monitoring, flow monitoring and water quality monitoring. A variety of software packages including the following, AutoCAD design tool, ESRIS GIS tool and the following hydraulic tools, Synergi and Info Works. Introduction TEAM OVERVIEW Team Overview Principal Designer Design Manager Investigation Manager Design Lead Design Co-ordinators MEICA Designer Trunk Main Designer CAD 2D / 3D Technicians Field Surveyor Add Images SERVICES What we Do... FIELD SERVICES What we do? Why we do it? Who we do it for? Question Time CONTACT INFORMATION Christopher Harris AMP 6 Regional Technical Manager Morrison Utility Services Centre 27 Business Park Woodhead Road Birstall Batley West Yorkshire WF17 9TD Mobile: 07921 308 622 www.morrisonus.com Contact Information What We Do Asset Condition Environmental Surveys Realtime working Drone Surveys Virtual Trial Holes Staff based across the North & Wales Region Design Offices Livingstone House, Leeds Bodalwyydan & Mona, North Wales Carmarthen & Newport, South Wales Woodhead House, Birstall 7 locations Meter U, Oldham

Effective Powerpoint Design

Transcript: Which Linearity to Choose? What is Linear vs Non-Linear? This title is far too dark for this background Linear or Nonlinear References There is nothing inherently wrong with either one, they just serve two very different purposes. Nonlinear allow for an easy presentation of multiple subjects or sub-categories, not always related, such as general design tips and linear vs nonlinear comparison. It allows an easier intractability to refer back to past information. Easy to integrate audience participation. Linear is effective at portraying a clear single subject or goal Timing is generally very predictable and easy to plan. Easy to summarize points or imparting facts. Conclusions Effective Presentation Design Nonlinear Presentations This text should probably be split up into different sub points via bullets but instead I’ve made an unsightly wall of text that is visually overwhelming and distracting to those that are viewing the presentation. The lack of spaces and overuse of text rather than outlining and allowing for the oral presentation to fill in the details also muddles the overall effect of the presentation. Overuse of wacky transitions and overly long animations is incredibly distracting when presenting information. Colors such as light blue or light yellow should probably be avoided for those with color blindness. Besides too many pictures, many are covering text or serve no real purpose. Each design of presentation isn’t good or bad, just used for a different purpose. Linearity is focused on fact presentation. Nonlinearity is focused on interactivity and flow. Slide design should conform to design standards. Color should stand out against the backdrop but not be blinding. Maintain a color scheme throughout for cohesion. Over use of transitions and animations is a major distraction. Having text structured makes it more clear. This being underneath and smaller text provides hierarchy and shows this is a related point. This also allows the view a clear means of identifying what you’re talking about. Clarity in text contrast and pictures to assist but not clutter is key to good design. This white, for example, shows well against the red backdrop. Ensuring images don’t cover text is also important. Good Keeping it structured and outlined. Use bullets to show what points are subordinate to overarching statements Especially for voiced presentations, don’t include every word you wish to say in the text, just outline the points. Light transitions and low stylization. Transitions can keep a presentation interesting as long as it’s not overly utilized. Use of pictures or video (non-autoplay) to support your point. Linearity allows for a step-by-step structured series of slides most effective in conveying facts or information that has little need for audience participation. Despite the transitions making it seemingly non-linear, this presentation is linear, as it follows a fixed path. Good and Bad Design Choices Thank you! We will discuss the best ways to make the best presentation possible. Picking between a linear or nonlinear style. Effective means of conveying a message. Pitfalls many presentations succumb to. Nonlinearity tools like prezi greatly help in managing clutter. The ability to zoom into smaller text allows it to not take up space on previous slides. Transitioning to focus on a video or picture is also very easy with varying slide sizes. Good Example Linear and Non-Linear Ways to Make the Best Presentation Linear Follows a set path going forward from slide to slide. Can’t go back to a previous slide. Generally forces conclusions for a section to be at the end. Uncomplicated, but that’s okay. Non-Linear Can reference back to past slides more easily. Can jump only to certain slides of information. Link between slides more similar to a website. Effective for unguided presentations. Now that you have an idea of which type of presentation to choose, slide design is also important. Many powerpoints stumble because of ineffective or overly cluttered design. Many mistakes come at the most fundamental level, making the wrong type of presentation. Being able to identify if it’s a simple, single message or user interactivity is key in initial design choice. Over-focus on nonlinearity in a powerpoint that really only needs to be a linear summary can seem overly complex. Linearity can be perceived as boring. This text has high contrast to the background By David Rosenberg How to Make an Effective Presentation Presentation Best Practices Knickerbocker, Vicky, and Brent Olsonawski. "The Good, The Bad, and The Ugly: Powerpoint Basics." Inverhills. N.p., n.d. Web. 17 June 2014. <https://www.inverhills.edu/StudentSuccessDay/pdfs/TheGoodBadandUglyPowerPointBasics.pdf>. "Microsoft PowerPoint 2003." PowerPoint 2003: Linking and Branching, UWEC. N.p., n.d. Web. 17 June 2014. <http://www.uwec.edu/help/PPoint03/lnkbrch.htm>. "Non-linear PowerPoint Presentation." Non-linear PowerPoint Presentation. N.p., n.d. Web. 17 June

Tag Global Delivery Centre_old

Transcript: Tag Global Delivery Centre Shared Services Template creation Powerpoint template created matching the colour themes and styles provided in PDF source. Design to brief Hand-drawn chart to be re-created Recreation The source provided in PDF had to be created in Powerpoint as per the brand guidelines and brand colours Recreation The excel data converted into wheel diagram format had to be created in Power Point as per the brand guidelines and brand colours. Design to brief Map creation to brief – output in PowerPoint Design to brief Enhancing a text message through design Design to brief Table creation Brand management Brand led PowerPoint document from a scanned copy Formatting & Beautification The Power Point source was to be formatted as per brand elements. Formatting & Beautification Slide The source was provided in Power Point and was required to be put in template and make it look visually appealing Formatting & Beautification The Power Point source was to be formatted as per brand Flow The source provided in Word was flowed on the brand template ensuring the correct styles are used and consistency is maintained. Flow The source provided in Word was flowed on the brand template ensuring the correct styles are used and consistency is maintained. Editable PDF PDF in editable format. Questions Thank You Design to brief Hand-written Post-its to be re-created to client template standard. Samples Skill-sets Current skill-sets Capability development Template creation Word template created matching the colour themes and styles provided in PDF source. Selection of serviced brands Presentations & Documents Template creation Word template created from the PDF source and brief. The request was to create user-friendly Word template to be used by users who aren’t proficient in Word with changeable as well. Overview Manages MS Office based requirements for our accounts Builds presentations and documents to a design led brief Team of 32 resources 24 x 5 service coverage and one shift over the weekend Key capabilities include: PowerPoint template design and animation Word template design MS Office brand management Visio creation PDF to Word file conversions Editable PDFs

Template Design

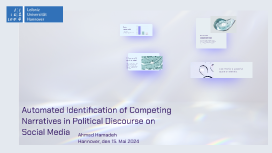
Transcript: Motivation Motivation Advantages both economically and politically. Influence public opinion, thus the ability to impact societal perceptions and even shape policy decisions. Can work as a framework for policymakers, social media platforms, and civil society to monitor and respond to the evolving landscape of political discourse. Keep your words short and punchy so your audience stays focused. You can add imagery and frames to keep their attention where you want it. Methodology A pipeline with 5 stages+ Data A pipeline with 5 stages+ Stage.1: Preprocessing Stage.2: Topic Modelling Stage.3: Event Detection Stage.4: Story Extraction Stage.5: Competing Narratives Detection 1.2 million tweets of European politicians extracted from Twitter for the period from January 1, 2022, to December 31, 2022. Tweets are narrowed down to tweets authored by German speaking politicians in 2022. Extracted tweets attributes: 'id', 'user-id', 'date', 'text', 'lang', 'translation' and 'sentiment'. Map of user party affiliation, which includes user IDs and their corresponding party affiliations. (Source: Wikidata) Put a bold statement here Use this space for details that you haven’t talked about yet. Relate what you’re saying to the nearby image so your audience has a visual, too. Use this for a powerful quote or statistic. Content Motivation Introduction.. Data. Method. Evaluation. Conclusion. Automated Identification of Competing Narratives in Political Discourse on Social Media Ahmad Hamadeh Hannover, den 15. Mai 2024 Conclusion

Now you can make any subject more engaging and memorable