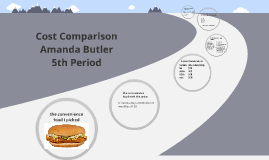
You're about to create your best presentation ever

Powerpoint Cost Comparison Template

Create your presentation by reusing a template from our community or transition your PowerPoint deck into a visually compelling Prezi presentation.

Cost Comparison

Transcript: Bibliography Car Expenses New-home median in 1911:$2,625 New-home median in 2014:$280,900 Cost of postage stamp in 1911:$.02 Cost of postage stamp in 2014:$.49 Average wage in 1911:$.22 per hour Average wage in 2014:$16.81 per hour Annual income in 1911:$983 Annual income in 2014:$35,00 *In 1911 there is no income tax , no social security and no unemployment insurance Cost of bread per loaf in 1911:$.05 Cost of bread per loaf in 2014:$3 Cost of Milk per quart in 1911:$.08 Cost of Milk per quart in 2014:$1.41 Cost of steak per pound in 1911:$.20 Cost of steak per pound in 2014:$4-8 Cost of potatoes per pound in 1911:$.2 Cost of potatoes per pound in 2014 : $.39 cost of bacon per pound in 1911: $.15 cost of bacon per pound in 2014 :$4.98 Income Car Cost in 1911: $1,130 Car Cost in 2014 :$31,252 Price of Gasoline per gallon in 1911:$.07 Price of Gasoline per gallon in 2014 :$2.14 "USA TODAY: Latest World and US News." USA Today. Gannett, n.d. Web. 26 Jan. 2015. <http://www.usatoday.com/> Food Cost Cost Comparison 1911-2014 Cost Comparison By: Lindsey Brinkman "Best of Patch | Local News, Community, Sports, Shopping, Restaurants, Things To Do." USA Patch. N.p., n.d. Web. 26 Jan. 2015. <http://patch.com/>. Over time many things change like technology, style ,and food . One important change is prices.Here is the price differences from 1911 and 2014 "The Food Timeline--historic Food Prices." The Food Timeline--historic Food Prices. N.p., n.d. Web. 01 Feb. 2015. <http://www.foodtimeline.org/foodfaq5.html>. Miscellaneous

Cost comparison

Transcript: Cost comparison October 2003 and October 2008 - 26 deaths and 6 cases of severe harm from bone cement use during hip surgery (NPSA) 1 1. Mitigating surgical risk in patients undergoing hip arthroplasty for fractures of the proximal femur: NPSA/2009/RRR001,March 2009 Swedish Hip Registry, 2011. Mortality vs risk of fracture Will this study change my practice? Implant diversity Underpowered High attrition rates Research personnel not blinded to intervention Negative points Study design Valid outcome measures Follow-up at 5 years Positive points Caution with interpretation of HHS as sample size low at 5 years May not have been better in ITT analysis Increased risk of fractures in the uncemented group Discussion Results 41 pts` 37 pts Follow-up at 3months, 1 year and 5 years Power calculation – 60 hips in each group required Materials and methods Inclusion: Aged 70 or over Intracapsular NOF # Exclusion: Unfit for arthroplasty Previous hip pathology Pathological fracture Ongoing infection Unable to walk before fracture Materials and methods To compare cemented bipolar hemiarthroplasty with a HA coated proximal press fit uncemented biplolar implant. Aims J Bone Joint Surg Br 2012 Aug;94(8):1113-9. Gjertsen JE et al Uncemented hemiarthroplasties had a 2.1 times increased risk of revision compared with cemented prostheses (95% confidence interval 1.7 to 2.6, p < 0.001). Most complications in uncemented hemiarthroplasties were within first year More re-operations after uncemented than cemented hemiarthroplasty used in the treatment of displaced fractures of the femoral neck: an observational study of 11,116 hemiarthroplasties from a national register. Cemented - 1 fracture (0.9%) Uncemented - 8 fractures (7.4%) p =0.035 Results Cemented bipolar hemiarthroplasty – Spectron (Smith and Nephew) Uncemented biploar hemiarthroplasty – Corail (Depuy) All patients 28mm co-cr head from same manufacturer as stem Posterior approach Postop protocol same for both groups Materials and methods Study carried out at Baerum and Oslo University Hospital – Norway Aatif Mahmood Registrar Orthopaedics Warrington Hospital 20/3/2014 Journal Club Int Orthop. 2013 Jun;37(6):1135-40. Talsnes O, et al Significantly increased mortality within the first day of surgery was found in the cemented group (relative risk 2.9, 95 % confidence interval 1.6-5.1, p=0.001). after adjusting for independent risk factors For the first post-operative day the number needed to harm was 116 (one death for every 116 cemented prosthesis). ASA 3 and worse, the number needed to harm was only 33. Perioperative mortality in hip fracture patients treated with cemented and uncemented hemiprosthesis: a register study of 11,210 patients. Cemented 56% Uncemented 60% p=0.38 Results Study Design Two-centre, randomised EQUIVALENCE trial Results of this RCT previously published at 1 year (2009) Harris Hip score Barthel Index EQ-5D score no difference between cemented and uncemented group Complications Duration of surgery 12 minutes shorter uncemented group Intraoperative blood loss 89 ml less Both implants may be used with good results uncemented group 1. Parker MJ, Gurusamy KS, Azegami S. Arthroplasties (with and without bone cement) for proximal femoral fractures in adults. Cochrane Database Syst Rev. 2010;6:CD001706 NOF #’s common in the elderly population and rising Optimum treatment still unknown Cochrane review1 -23 trials including 2861 patients with – uncemented implants: decreased mobility and increased pain Background

Cost comparison project

Transcript: Cost comparison between Minneapolis and Mumbai The Indian currency is called a rupee. The conversion rate fluctuates between the rupee and the U.S. dollar. Normally it is around 54 rupees per dollar. All units in this project will be converted to dollars and the standard system. In Mumbai one gallon of gas is roughly 10 dollars. While in Minneapolis the cost of a gallon of gas is around 3 dollars a gallon. The cost for gas in Mumbai is higher because of higher taxes as well as greater demand. Normally large cities have higher gas costs because of the demand for gas. A loaf of white bread in Mumbai costs 40 cents. While in Minneapolis the cost of a loaf of bread is around 1 dollar and 30 cents. This might be do to the difference in quality of bread as well as mark up costs of grocery stores. The price for a gallon of milk is about the same: around 3.8 dollars. The audi a4 3.0 tdi model costs 75,874 dollars in Mumbai while in Minneapolis it costs 68,900 dollars. This is because Indian trade tariffs are higher then those of the USA. In Mumbai the new 27 inch iMac is 2,509 dollars, while in Minneapolis the same computer ranges from around 1,799-1,999 dollars. Again this is because of tariffs. This is also because apple is an american company and therefore is cheaper in the USA because of less import costs The average income in Mumbai is 258 dollars per year. However, Mumbai is a city of extremes. There are people who are multi-millionaires as well as people who are starving. Because of these extreme outliers the average is not very accurate. Even though luxury prices are generally higher in India, the basic necessities can be bought cheaply. In Minnesota, on the other hand, the average income is 42,847 dollars, far exceeding that of Mumbai. The income and cheaper products are why luxury items are more common in Minnesota. Loaf of bread Gallon of milk Gasoline Cost Audi A4 3.0 tdi model 27 inch iMac

Now you can make any subject more engaging and memorable