Society's Bell curve
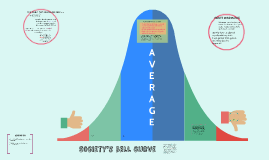
Transcript: People with a shoe size of 6-9 are standard citizens and earn modest incomes and live comfortablty. People with a shoe size of 9 and above are deemed superior and have been in power since the development of the civilization The extreme ends of the curve represent the least frequently occuring subset of the identified trait, while the most common subset of the traits lie between the ends and the most common occurence can be found at the middle of the graph Caucasian Male Our inclination to order items by ranking them in a linear series of increasing worth. Gould, S. (1981). The mismeasure of man. New York: Norton. Topic: Homosexuality. (n.d.). Retrieved October 28, 2015. Clean Bill of Health In a world (not so) far, far away....... Reductionism ....being "normal"! Those unfortunate souls who have small feet are doomed to a life with no access to shoes and are forced to depend on others to survive. Murray and Herrnstein believed those who fall on the extreme ends of the curve are doomed to stay there, that there is nothing that can be done to improve their placement. Ultimately, their argument was to give up hope for improvement among those "less than." References Society's Bell curve Society's expectations do not conform to the very nature of the tool those who study these kinds of phenomena are using to describe it! We would never let shoe size determine how we identify our status in society. Shoe size is such an arbitrary trait! Why not? IQ score: 145-175 Maybe.. X-Axis: trait under inspection, said trait is quantified in order to be placed on the graph Y-Axis: frequency of the population Vertical lines represent categories within the given trait. Society is hierarchical in nature, organized by SHOE SIZE All body parts intact and functional No diagnosis of a mental illness or disorder Not over or under weight Average stature No diagnosis of a chronic illness Unimpaired learning capacity Not dyslexic, ADD, ADHD, etc. Earning a spot at the top means.... Deafness is another thing that cannot be graphed on a bell curve, unfortunately, deaf people have also been subject to "society's bell curve" and have been forced to live their lives as "outliers" for as long as history. It is important for society to stop comparing every little trait to the bell curve! Deaf people have much more to offer than their hearing status, but all too often - that becomes their label. Like homosexuality, deafness is a multi-faceted and complex identity that should not be reduced to a single entity. That's ridiculous! Components of the bell curve So why have we allowed equally arbitrary traits (race, gender, intelligence, etc.) to do just the opposite? The bell curve theory does not apply to humanity as a whole. riˈdəkSHəˌnizəm/ noun The practice of analyzing and describing a complex phenomenon in terms of phenomena that are held to represent a simpler or more fundamental level, especially when this is said to provide a sufficient explanation. A tool created to categorize traits (of nature, statistical items, intelligence, human features, etc.) in isolation A highly influential book written by Murray and Herrnstein on the application of the bell curve to human features, namely intelligence The curve itself is divided up into sections that ultimately rank the individual's intelligence level along a spectrum from highly desireable on one end to beyond repair on the other However, the ranking of intelligence was originally created simply to identify students in need of additional support in school. Along the way, though, the focus got skewed and the ranking system began. In our society, we tend to map all human characteristics on the bell curve and oppress and essentially move to "dehumanize" those who do not fall on the upper half of the graph on certain standards. What about deafness? We, as a society reduce people to single qualities (e.g. deaf, black, down syndrome). Every person has so much more to offer than their flaws. Human-ness cannot be defined by parsing out and ranking features along a graph. Society would benefit from taking a holistic view of the people it encompasses. The majority of people fall somewhere in the middle, the extremes ends of the curve are outliers and can only be expected to apply to a small percentage of the population. The statistics behind the bell curve are correct, however, the ramifications were created by oppression NOT statistics. The system of oppression has made sure that those who are less fortunate, either financially, intellectually, racially, (the list goes on and on) stay that way. A V E R A G E Hierarchy Real World Example Hearing (not deaf) Clean bill of health The majority of people in America identify as heterosexual, while a small percentage of people identify as gay, lesbian, or bisexual (7% of the poulation). While the LBGTQ community could be considered the "outliers," sexuality is not quantified, and it would be difficult to do so. Additionally, many Americans believe that


