PowerPoint Simple Fishbone Diagram Template
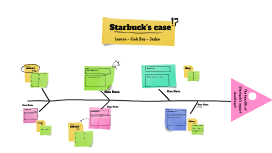
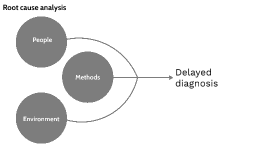
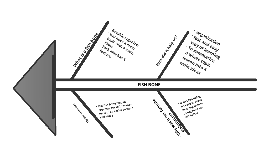
Transcript: Effective Problem Analysis Use this fishbone diagram template to present the root causes of issues clearly and effectively. It is ideal for scenarios that require a structured analysis of factors affecting performance or outcomes. Minimal Text for Maximum Impact When to Use This Template This template supports minimal text usage, enhancing the focus on key points and making complex information more accessible to the audience. Versatile Application in Business and Education The fishbone diagram is especially useful in business and educational contexts for identifying underlying issues and creating actionable solutions, making presentations more effective. Understanding the Fishbone Diagram The fishbone diagram, also known as the Ishikawa or cause-and-effect diagram, is a visual representation that systematically categorizes potential causes of a problem. It facilitates root cause analysis by organizing these causes into distinct categories, enhancing clarity in identifying underlying issues. Visual Segmentation Streamlined for Clarity Each segment of the fishbone is visually distinct, guiding the audience's attention toward relevant written content. This design helps in making complex relationships easier to understand at a glance. The fishbone diagram is designed for clarity, allowing for a focused presentation of information. Its streamlined structure enhances the flow of communication, ensuring that key points stand out effectively. Segment Breakdown of the Fishbone Diagram Understanding the components that contribute to problem analysis. PowerPoint Simple Fishbone Diagram Template Text One Text Two Text Three Text Four Text Five Text Six Text Seven Text Eight Discusses the fourth factor, emphasizing the relationships among different components. Covers the fifth factor, linking it to previous elements for a comprehensive view. Identifies the first factor affecting the issue being analyzed, providing initial insights. Highlights the second factor, adding depth to the analysis and facilitating further discussion. Explores the third factor, illustrating its impact on the overall problem and solutions. Illustrates the sixth factor, providing additional context for the ongoing evaluation. Examines the seventh factor, reinforcing the connection to the overall theme of the fishbone diagram. Concludes with the eighth factor, summarizing its relevance to the analysis at hand. Minimized Text for Clarity Highlighting Key Points A streamlined approach to analyzing causes and effects in business and education using a minimalistic fishbone diagram. The fishbone diagram's design promotes clarity by minimizing text, allowing the audience to focus on essential information. Versatile Applications of the Fishbone Diagram The fishbone diagram serves as an effective tool across diverse sectors such as business and education. It assists teams in pinpointing root causes of challenges, fostering effective problem-solving approaches, and streamlining operational processes, ultimately enhancing performance and decision-making. Summarizing the Fishbone Diagram's Impact The fishbone diagram is an essential analytical tool that simplifies complex problems by categorizing causes, fostering clarity and engagement. Its visual format enhances understanding, making it ideal for effective presentations. The inclusion of a Q&A session further allows for clarification and deeper discussion of the identified issues.