You're about to create your best presentation ever

Financial Analysis Presentation Template

Create your presentation by reusing one of our great community templates.

Financial Analysis Presentation

Transcript: Anything below 1 means they can't pay those off, They are at 1.3. Vertical Analysis (Income Statement) What is Westshore Terminals investment? measures a company's ability to pay short-term obligations. The 2009 fiscal year; Expenses were well used turning over 59% retained earning. Exempt from income tax due to government subsidies. The 2010 fiscal year; Westshore has seen major losses during the periods with 23% net loss This was planned as investments were put forth in a three-year capital upgrade program. Exempt from income tax The 2011 fiscal year; All expenses for that year were recovered. with an net income increase of 17% measures a company's financial leverage and indicates what proportion of equity and debt the company is using to finance its assets. Balance Sheet & Income statement measures a firm's efficiency at using its assets to generate sales Ever since the companies creation they have done nothing but grow. They have undergone 4 major equipment upgrades, most recently in 2012 providing them with the latest and most advanced technology. In the 1st quarter of 2012, which ended March 31, they had already over 48 million dollars in revenues. The Debt-to-Equity Ratio is 5.8898 Analyzing Horizontal Equities In comparison to 2010, The 2011 fiscal year; Revenue decreased by 4.8% Expenses decreased by >50% Net Income increased by 72.2% Efficient use of Money due to Higher leverage They are at 1.4 which means that they are able to pay for any short-term liabilities and still have something left over. N/A N/A The Acid test Ratio is 1.2816 The Return on Sales Ratio is 0.1720 The Return on Equity Ratio is 0.5036 FIN. BY Kevin, Emilija, Mark and Jacob YUP! Income over the last year has increased substantially and it seems they are using their cash flow much more efficiently. They are cutting expenses in half. They predicted to be in debt along with a net loss in fiscal 2010. In hopes these investments will generate profit in future years. They are an aggressively competitive company that is aware of their financial boundaries. In year 2011, they were more than capable to generate a net profit aside from incurred short term liabilities from the previous year investments. Total Asset Turnover Ratio is 0.3771 evaluates a company's operational efficiency. The value determines how much profit per dollar they are making off of 'sales'. Determines whether or not they have enough short-term assets to pay off short-term liabilities without selling inventory. The Return on sales is $0.17 off of every dollar. Which is a decent amount in the coal industry. measures a corp's profitability based off of how much profit is generated from the money invested by shareholders. Companies usually aim for high asset turnover. Typical ratio is over 1.5. Therefore, Westshore lack in proper use of asset. The Current Ratio is 1.4142 Westshore Terminals Limited Partnership is a coal export terminal company. It is located at Robert’s Bank, Delta, British Columbia. Only about 30 km away from downtown Vancouver. Since the companies opening in 1970, Westshore Terminals Limited Partnership has been the premier coal exporter in Canada. In 2010 they shipped a record of 24.7 million tonnes, on to be surpassed in 2011 when their exports amassed an incredible 27.3 million tonnes of coal. Westshore Terminals Limited partnership exports their coal to over 20 countries around the world. They are the largest coal export company in Canada, and in recent years all of North America bringing in billions of dollars in export revenue to Canada and British Colombia. Financial Analysis Presentation Horizontal Analysis Invest or Not? Return on Equity is expressed as a percentage, Therefore, they have 50% which is very significant among many companies. They have a 5.9 and high debt-to-equity means that the company was being aggressive in financing its growth with debt.

Financial Analysis Project Presentation

Transcript: Amazon has managed in increase in revenue income for the past five years consecutively between 2010 and 2014. In 2010, the company’s revenue was 34.2 billion USD, and it increased to 48.08 billion by 2011. Amazon's Stronghold Market Mission & Objective By: Josselyn Chavarria Investment: Amazon invest heavily on key partners in order to reduce costs Amazon Web Services: Cloud program for online storage Amazon Prime: Memberships for discounts and trials Amazon’s vision is to be earth’s most customer centric company; to build a place where people can come to find and discover anything they might want to buy online. Objective- ‘Not to discount a small number of products for a limited period of time, but to offer low prices everyday and apply them broadly across our entire product range. 'Core Value Proposition• Price• Convenience• Selection Strategy• ‘To ‘Get Big Fast’ by investing aggressively in new product categories and new businesses, by spending money on brand awareness and getting new customers.’ Revenue Model and streams The corporation's stock soared in 2015 demonstrating an increase of more than 70%, and the most recent few quarters this year have far exceeded even the most generous predictions made by the market experts. Financial Analysis Project Presentation Amazon Publishing: On demand publishing Subscribe & Save: Subscriptions for discounts on daily deals. Amazon Basics: Product development (Cd’s, Cables, Software) CPM, CPC, Sponsorship, Affiliate programs, transaction fee revenue E-mail marketing This increase in growth shows no signs of stopping as experts predict the company will continue to hold a stronghold on the e commerce sector. Amazon.com Incorporated is an e commerce company selling a huge selection of products including, but not limited to books, DVDs, movies, electronics, computers, videotapes, and home and garden products.

Financial Analysis Presentation

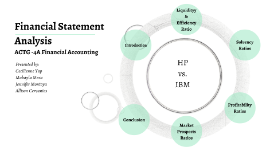
Transcript: Presented by: Cecilienne Yap Makayla Meza Jennifer Montoya Allison Cervantes HP vs. IBM Financial Statement Analysis ACTG -4A Financial Accounting Introduction HP and IBM HP Hewlett-Packard Company (HP) Founded in 1939 by Bill Hewlett & Dave Packard Based in Palo Alto, California Operates in over 170 countries worldwide Specializes in developing and manufacturing computer hardware, data storage, networking hardware, and software design Main products include: personal computing devices, enterprise and industry standard servers, storage devices, networking products, software, various printers, and imaging products Markets towards: household, businesses, enterprises, electronics and office supply retailers, software partners and major technology vendors IBM International Business Machines Corporation (IBM) Founded in 1911 and was a merger of three companies Formerly know as Computing-Tabulating-Recording Company (CTR) Renamed company to IBM in 1924 Based in Armonk, New York Provide computer software for computing, operating and security systems Credited with the invention of the ATM machine, disk drives and magnetic strips on credit cards Liquidityy & Efficiency Ratio Liquidity and Efficiency Ratios Hewlett-Packard Company (HP) Hewlett-Packard Company (HP) 2015 Current Ratio - 1.04 Acid-Test Ratio - .97 Inventory Turnover - 18.6 2016 Current Ratio - 1.28 Acid-Test Ratio - 1.01 Inventory Turnover - 18.3 International Business Machines Corporation (IBM) International Business Machines Corporation (IBM) 2016 Current Ratio - 1.21 Acid-Test Ratio - 1.04 Inventory Turnover - 26.82 Solvency Ratios Solvency Ratios Hewlett-Packard Company (HP) Hewlett-Packard Company (HP) 2015 Times-Interest-Earned Ratio -14.72 Debt-to-Equity Ratio - 1.38 2016 Times-Interest-Earned Ratio-14.84 Debt-to-Equity Ratio - 1.53 International Business Machines Corporation (IBM) International Business Machines Corporation (IBM) 2016 Times-Interest-Earned Ratio- 20.57 Debt-to-Equity Ratio - 5.44 2015 Times-Interest-Earned Ratio- 35.07 Debt-to-Equity Ratio - 6.75 Profitability Ratios Liquidity and Efficiency Ratios Hewlett-Packard Company (HP) Hewlett-Packard Company (HP) 2015 Profit Margin Ratio - .16 Gross Profit Ratio - 28.7% Return on Assets Ratio - 3.1% 2016 Profit Margin Ratio - .22 Gross Profit Ratio - 29.2% Return on Assets Ratio -3.9% International Business Machines Corporation (IBM) International Business Machines Corporation (IBM) 2015 Profit Margin Ratio - .31 Gross Profit Ratio - 47.9% Return on Assets Ratio-27.5% 2016 Profit Margin Ratio - .32 Gross Profit Ratio - 56.4% Return on Assets Ratio-29.3% Market Prospects Ratios Liquidity and Efficiency Ratios Hewlett-Packard Company (HP) Hewlett-Packard Company (HP) 2016 Price Earning Ratio - 11.53 Dividend Yield Ratio - 4.38% The price-earnings ratio is a measurement that investors use to evaluate whether a stock price is a good value. In 2016 HP had a low P/E ratio of 11.53 meaning that it is a bargain which indicates that the market expects little growth in the company's earnings. International Business Machines Corporation (IBM) International Business Machines Corporation (IBM) 2016 Price Earning Ratio - 14.29 Dividend Yield Ratio - 1.4 Inventory Turnover - 26.82 On the other hand, in 2016 IBM had a high P/E ratio of 14.29 which can mean the market expects growth or that its share price is too expensive. Conclusion Conclusion Even though HP made improvements in the year, IBM has higher numbers overall. Based on the criteria explored we confidently rank IBM higher than HP.

Group Financial Analysis Presentation

Transcript: GENENTECH Group Financial Analysis Amar, Annie, Jasper & Nancy Genentech Rapid Growth Actual Growth > Sustainable Growth Roche Slow Growth Sustainable Growth > Actual Growth Final Assessment: Roche is still worth the investment! History Market Value Hence, The Genentech/Roche merger Strategy Resources Roche Post-merge: Product Prediction Data http://www.gurufocus.com/stock/RHHBY Pharmaceuticals Medical Research Gracias ! Thank you! Drug deal: Roche buys Genetech for $46.8 billion. (3/12/09). Retrieved from http;/usatoday.30.usatoday.com/money/industries/health/drugs/2009-03-12-roche-buys-genetech_N.htm Genentech Profitability http://www.roche.com/investors/financial_data.htm 1976 - Founders of BIOTECHNOLOGY Industry Robert A. Swanson and Herbert Boyer 2009 - Genentech becomes a member of Group Prediction Analysis Genentech Pre-merge: 3/26/09 - Genentech (DNA) closed $95 per share Roche buys Genentech for $46.8 Billion Preguntas? Questiosn? Genentech Announces Long-Term and Financial Goals. (March 12, 2009). Retrieved from http://www.gene.com/media/press-releases/7267/2004-03-12/genentech-announces-long-term-strategy-a According to Genentech's Strategy and Financial Goals Statement Focus on Growth - Horizon 2010 (5x5) Financial Expectations And Goals 20% annual non-GAAP growth per year Commercial Strength Building new markets, introducing new products and educating the medical community Successful Product Portfolio Continue to grow develope and udate current drugs on the market Keeping the Pipeline Full New medical breakthroughs, focus on oncology research Profit Analysis

Financial analysis

Transcript: Economic analysis Definition Systematic approach to determining the optimum use of scarce resources The purpose of the economic analysis... The purpose of the economic analysis of projects is to bring about a better allocation of resources, leading to enhanced incomes for investment or consumption. The procedure for undertaking economic analysis .... • defining project objectives and economic rationale; • forecasting effective demand for project outputs; • choosing the least-cost design for meeting demand or the most cost-effective way of attaining the project objectives; • determining whether economic benefits exceed economic costs; • assessing whether the project's net benefits will be sustainable throughout the life of the project; • testing for risks associated with the project; • identifying the distributional effects of the project, particularly on the poor; and • enumerating the nonquantifiable effects of the project that may influence project design and the investment decision. Economic analysis vs Financial analysis Both types of analysis are conducted in monetary terms, the major difference lying in the definition of costs and benefits. In financial analysis all expenditures incurred under the project and revenues resulting from it are taken into account. This form of analysis is necessary to: • assess the degree to which a project will generate revenues sufficient to meet its financial obligations, • assess the incentives for producers, and • ensure demand or output forecasts on which the economic analysis is based are consistent with financial charges or available budget resources. Economic analysis differs from financial analysis in terms of both (i) the breadth of the identification and evaluation of inputs and outputs, (ii) (ii) the measure of benefits and costs. THANK U FOR YOUR ATTENTION! Questions?? Presented by: Zhailyauov Askar Kovalyov Alexey Baiburin Sarsen • defining project objectives and economic rationale; • forecasting effective demand for project outputs; • choosing the least-cost design for meeting demand or the most cost-effective way of attaining the project objectives; • determining whether economic benefits exceed economic costs; • assessing whether the project's net benefits will be sustainable throughout the life of the project; • testing for risks associated with the project; • identifying the distributional effects of the project, particularly on the poor; and • enumerating the nonquantifiable effects of the project that may influence project design and the investment decision.

Financial Analysis Presentation

Transcript: Solar Array Specifics Presented By: ROI Presented to you by: Moody Street V(PW)=Variance Present Worth V(PW)=E(PW)2-[E(PW)]2 V(PW)= $11,671,996,158,377,600,000.00-[$4,740,888.73]2 V(PW)= $749,924,085,141,806,000.00 SD(PW)=Standard Deviation Present Worth SD(PW)=√[V(PW)] SD(PW)=√[ $11,671,996,158,377,600,000.00] SD(PW)= $865,981,573.21 Scenario 2 What are the Expected Present Worth (E(PW)), Variance Present Worth (V(PW)) and Standard Deviation (SD(PW)) associated with the purchase of the equipment? Timothy Hayes We looked at 3 scenarios Scott Richards Westin Moody Street What is the ROI, IRR, Risk, Replacement Analysis of the Solar array at Berkshire Community College? Glenn Abriam Replacement Analysis Questions? IRR -$797,137 -$740,201 -$678,003 -$615,240 -$549,835 -$481,766 -$411,010 -$337,843 -$271,942 -$193,283 -$111,840 -$155,560 $183,292 $530,039 $884,809 $1,237,733 $1,608,927 $2,031,657 $2,461,424 $2,898,369 $3,342,636 8% Technology advancement analysis Replace existing array after 10 years Replace with 1000 Watt panels Assume salvage value Assume same cost as original panels Statewide CC Marketing initiative Conclusion Analyze existing array Campus cost only CREB 20 lifetime No replacement panels Glenn Abriam Scenario 3 • Radio, TV, Pandora & Hulu • 21 million impressions at the end of the campaign • Video production company that created SNHUs commercials • Aimed at working adults ages 25-49 looking to make a career change • If funds are available, MCCEO could run the campaign during summer (September enrollments). • MECCO considering billboards for the future Ashley Boyd The useful life of the replacement solar array is uncertain, so the present worth (PW) of the new solar array for different useful lives (N) is calculated as: Total Capital Invested = Total Capital Costs - Total Salvage Costs + Total O&M Costs - Total CREB until break even point (FY23=$914,028) Total Capital Invested = $1,307,940 - $187,400 + $124,200 - $914,028 Total Capital Invested = $330,712 Savings/Year = (See Table) MARR = 20% Evaluation of a Replacement Solar Array Project Life as a Random Variable Presented by ROI is used to evaluate the efficiency of an investment. The Return on Investment formula: (Gains from Investment-Cost of Investment) / Cost of Investment For our Project: Revenue CREC + Solar Savings-Operations & Maintenance-Principle& Interest / Investment ROI after 20 Years Revenue CREC + Solar Savings - O & M - P & I - Investment / Investment $1,523,380+$1,326,838-$124,200-$965,556-1,800,000 / 1,800,000 ROI(1)=-2.2% ROI(2)=136% ROI(3)=298% PW(N)=Capital Investment + Savings (P/A,i%,N) PW(N)=-$330,712+$[SavingsN](P/A,20%,N) PW(12)=-$ 330,712+$312,442(P/A,20%,15) PW(12)=-$ 330,712+$312,442 (4.4392) PW(12)= $1,717,705 PW(13)=-$ 330,712+$318,691(P/A,20%,15) PW(13)=-$ 330,712+$318,691(4.5327) PW(13)= $1,775,243 With the original installed cost of the replacement solar array being $1.8 million, less the Salvage Costs O&M Costs and the CREB credits and a total capital investment of $330,712; the expected present worth value of the solar array after 21 years of life is a positive value of $4,740,888.73 With SD(PW)= $865,981,573.21, approximately 444.7 times the value of E(PW), this indicates a relatively high variability in the measure of economic merit, PW of the project, and is usually an unaffordability of project acceptability. IRR Scenario 3 http://live.deckmonitoring.com/?id=berkshire_overview MSFM - Massachusetts Maritime Academy Financial Analysis for Facility Managers Professor Lehan Ashley Boyd Moody Street Analyze existing array $1.8 million ARRA Funds CREB 20 year lifetime No replacement panels E(PW)= $4,740,888.73 V(PW)=$210,092,944,515,310.00 SD(PW)= $865,981,573.21 SD(PW)>E(PW) $865,981,573.21>$4,740,888.73 444.7 times the value of E(PW) Scenario 1 For our Project: Revenue CREB + Solar Savings- Operations & Maintenance-Principle& Interest/ -Investment E(PW)=Expected Present Worth E(PW)= PW(12) p(12)+ PW(13) p(13)+ PW(14) p(14)+ PW(15) p(15)+ PW(16) p(16)+ PW(17) p(17)+ PW(18) p(18)+ PW(19) p(19)+ PW(20) p(20)+ PW(21) p(21) E(PW)= $1,947,481.49 E(PW)2=[PW(12)]2 p(12)+ [PW(13)]2 p(13)+ [PW(14)]2 p(15)+ [PW(14)]2 p(15)+ [PW(16)]2 p(16)+ [PW(17)]2 p(17)+ [PW(18)]2 p(18)+ [PW(19)]2 p(19)+ [PW(20)]2 p(20)+ [PW(21)]2 p(21) E(PW)2=$749,927,877,825,946,000.00 1874 Panels 7 Buildings 210 Watts / panel 20% - 25% of total campus 400,000 kWh 20 year lifetime Challenges

Now you can make any subject more engaging and memorable