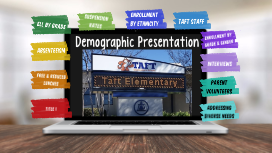
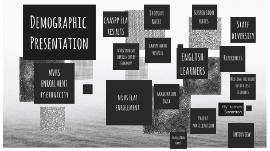
Demographic Presentation
Transcript: Demographic Presentation Title 1 William Howard Taft Elementary is a 100% Title 1 School! Free & Reduced Lunches Free and Reduced Lunches Free and Reduced Lunches As our population continues to drop, the number of students who are on free and reduced lunches also continues to decline. However, the overall need for this program has not changed. We are fortunate to have partnered with a local non profit group. This group provides "Snack Attack" to families within this subgroup who are classified as homeless to provide "snack" bags every Friday. These snack bags include juices, carrots, and various other snacks to ensure they will have access to some food over the weekend. Absenteeism Absenteeism Rates for 2019 Click to edit text Ell by Grade English Language Learners The primary language of our English Language Learners is Spanish. This subgroup represents 92.62% of our Taft ELL population. During the 2019-2020 school year, 14.1% of ELL students became proficient, compared to only 8.54% the previous school year. Suspension Rates Suspension Rates Expulsion Rates Explusion and suspension Given the new laws on suspension and explusion, principals are less likely to use either of these options especially since these rates are tied to our accountability reports. It is very unfortunate and requires staff to accept any and all behaviors, specifically defiance. Enrollment by Ethnicity Ethnic Breakdown of Taft Elementary Taft is home to 619 students. The ethnic breakdown of our population is comprised of nine different subgroups. The Hispanic or Latino community represents 65.9% of our population. The next largest subgroup represented are Non-Hispanic Whites at 21%. African Americans are the next largest subgroup represented at 5.5%, followed by the subgroup representing two or more races. This group comprises 4.4% of our population. The remaining racial subgroups represent less the 1% of our remaining population. Our population is consistent who with the overall breakdown of Riverside Unified and Riverside County. Taft Staff Taft Staff During the 2019-2020 school year, Taft Elementary had 30 teachers. We have hired a part time SELPA, in addition to the one full time teacher we already had. We have also hired a part time School Psychologist and a part time SAP Counselor. We also had an intern SAP Counselor who assisted in conducting Community Circles. The three part time positions split their time between Taft and another school in the district. Enrollment by Grade & Gender Breakdown by Gender There are 619 students at Taft. There are 345 Males and 274 Females. The included spreadsheets breakdowns the genders by Ethnicity. Hispanic Females respresented the largest group at Taft. Males Females Mr. Torres, Principal Interviews According to Mr. Torres, Taft Elementary is able to meet the needs of our diverse population throught the following commitments. AVID Implementation from TK-6th Focus is on Note taking Skills (Tk-6) Close Reading Strategies Schoolwide focus on Literacy Comprehension Used to enhance instruction and student learning across all subjects. 1:1 Chromebooks Grades 1-6 Both Interventions provide foundational reading skills to students at risk. K-2 Institute & BOOST Interventions Wonders & Project Moving Forward are used for ELD. Daily Designated & integrated ELD System 44 3rd & 4th Grade Pull Out intervention Ela Core Replacement for 5th & 6th Graders This is the greatest issues that taft faces. We average 30-50 students being absent per day. The largest group who experiences absenteeism comes from our homeless population. Absenteeism Parent involvement Parent Volunteers We average 9 Volunteers per Day Each Volunteer averages 1 hour per day! Parents volunteer at least once per week Types of Volunteer work Book Fairs, classroom assistance, Carnivals, Lunch with your students, Red Ribbon week, & Fieldtrips Ways we address the needs of our diverse population Addressing Diverse Needs SaP Counselor on site SAP Counselor Conducts weekly Community Circles, Anger Mangement Groups, and Social Skills Groups Americorps Students form UCR 100 Mile CLub Community outreach "Snack Attack" Read Across America Reflections PTA Sponsored Event focuses on celebrating the Arts through multiple artist venues. MTSS Approach H.E.R.O. Program Incentive based program for students to earn tangible rewards of their choice. Monthly ELAC Meetings Parental involvement Monthly PTA Meetings Annual Harvest Festival Annual Winter Festival Tri- Annual Lunch with your student. Diverse Community involvement What more is needed We need more community events that represent the Hispanic Culture. Our campus is 66% Hispanic and we need to embrace what their cultural diversity has to offer. Assemblies Anti-Bullying School wide Pledge Guest Speakers Student expectations Assemblies Trimester Awards Parent workshops