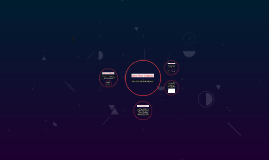
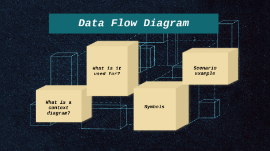
You're about to create your best presentation ever

Data Flow Diagram Template Powerpoint

Create your presentation by reusing a template from our community or transition your PowerPoint deck into a visually compelling Prezi presentation.

Data Flow Diagram

Transcript: Terminators There are different levels of data flow diagram. The context level or level 0 data flow diagram is basically a diagram showing a very generalized diagram with the terminators linked to the current system as a whole. The next level is level 1. It would have many more processes, with more detail about all aspects of the system. It is important that the direction of data flow is accurately recorded and that each arrow is labeled to show what data is flowing at that point in the diagram. Data Flow Diagram The order has come from a customer; customers are not part of the process order system and so are placed in a terminator. When data flows from or to somebody or somewhere outside the system, that smehow or somewhere is called a terminator. by Ayesha Abdulhakim Al Sagaf Processes The data from the customers are the orders. This information is processed to produce the invoices. The process order is put in a process box. Flow arrows Peter and Irene deal with customer orders. The customer sends in an order to the company and it is checked to see if it has all the information required such as customer name and address and an order for an existing product. If it does not, it is rejected and sent back to the customer. If it does, the order is processed and the other information is printed and filed. In addition, an invoice is generated and filed ready to send to the customer. The actual data output from the system, such as the individual invoices and the printed orders, are recorded for future use. Although this is not kept on computer, the data can still be viewed as being stored. Such data is therefore called a store. Stores It consists of four components which are terminators, processes, flow arrows and stores. Data Flow Digram

Data Flow Diagram

Transcript: Data Flow Diagram Made by: Sarah Lohamor What is DFD? What is DFD? A DATA FLOW DIAGRAM (DFD) illustrates how data is processed by a system in terms of inputs and outputs. As its name indicates it is the flow of information, where data comes from, where it goes and how it gets stored. DFD Notations DFD Notations Notations are the way you present something, for example: Reshma and Rahul use squares to represent their processes whereas I use circles to represent my processes. These data flows are the inputs and outputs of the DFD and are known as notations. External Entity External Entity An external entity can represent a human, system or subsystem. It is where certain data comes from or goes to. It is external to the system we study, in terms of the business process. For this reason, people used to draw external entities on the edge of a diagram. Process Process A process is a business activity or function where the manipulation and transformation of data take place. A process can be decomposed to a finer level of details, for representing how data is being processed withing process. Data Store A data store represents the storage of persistent data required and/or produced by the process. Here are some examples of data stores: membership forms, database tables, etc. Data Store Data Flow A data flow represents the flow of information, with its direction represented by an arrowhead that shows at the end of flow connector. Data Flow Importance of DFD Importance of DFD DFDs can provide a detailed representation of system components. DFDs are easier to understand by technical and nontechnical audiences Provide functional breakdown of the system A straightforward graphical technique which is easy to recognise. Example Example

Now you can make any subject more engaging and memorable