You're about to create your best presentation ever

Blank Fishbone Diagram Template Powerpoint

Create your presentation by reusing a template from our community or transition your PowerPoint deck into a visually compelling Prezi presentation.

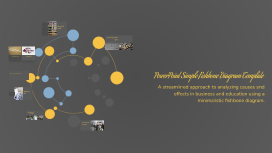
PowerPoint Simple Fishbone Diagram Template

Transcript: Effective Problem Analysis Use this fishbone diagram template to present the root causes of issues clearly and effectively. It is ideal for scenarios that require a structured analysis of factors affecting performance or outcomes. Minimal Text for Maximum Impact When to Use This Template This template supports minimal text usage, enhancing the focus on key points and making complex information more accessible to the audience. Versatile Application in Business and Education The fishbone diagram is especially useful in business and educational contexts for identifying underlying issues and creating actionable solutions, making presentations more effective. Understanding the Fishbone Diagram The fishbone diagram, also known as the Ishikawa or cause-and-effect diagram, is a visual representation that systematically categorizes potential causes of a problem. It facilitates root cause analysis by organizing these causes into distinct categories, enhancing clarity in identifying underlying issues. Visual Segmentation Streamlined for Clarity Each segment of the fishbone is visually distinct, guiding the audience's attention toward relevant written content. This design helps in making complex relationships easier to understand at a glance. The fishbone diagram is designed for clarity, allowing for a focused presentation of information. Its streamlined structure enhances the flow of communication, ensuring that key points stand out effectively. Segment Breakdown of the Fishbone Diagram Understanding the components that contribute to problem analysis. PowerPoint Simple Fishbone Diagram Template Text One Text Two Text Three Text Four Text Five Text Six Text Seven Text Eight Discusses the fourth factor, emphasizing the relationships among different components. Covers the fifth factor, linking it to previous elements for a comprehensive view. Identifies the first factor affecting the issue being analyzed, providing initial insights. Highlights the second factor, adding depth to the analysis and facilitating further discussion. Explores the third factor, illustrating its impact on the overall problem and solutions. Illustrates the sixth factor, providing additional context for the ongoing evaluation. Examines the seventh factor, reinforcing the connection to the overall theme of the fishbone diagram. Concludes with the eighth factor, summarizing its relevance to the analysis at hand. Minimized Text for Clarity Highlighting Key Points A streamlined approach to analyzing causes and effects in business and education using a minimalistic fishbone diagram. The fishbone diagram's design promotes clarity by minimizing text, allowing the audience to focus on essential information. Versatile Applications of the Fishbone Diagram The fishbone diagram serves as an effective tool across diverse sectors such as business and education. It assists teams in pinpointing root causes of challenges, fostering effective problem-solving approaches, and streamlining operational processes, ultimately enhancing performance and decision-making. Summarizing the Fishbone Diagram's Impact The fishbone diagram is an essential analytical tool that simplifies complex problems by categorizing causes, fostering clarity and engagement. Its visual format enhances understanding, making it ideal for effective presentations. The inclusion of a Q&A session further allows for clarification and deeper discussion of the identified issues.

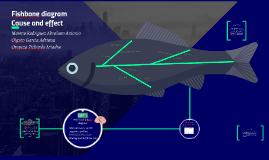
Fishbone diagram

Transcript: OLD CARS Moreno Rodriguez Abraham Antonio Olguin Garcia Adriana Oropeza Pichardo Ariadne CONCLUSION ENERGY REFORM SPEED LIMITS Fishbone procedure TRAFFIC JAM When to use fishbone diagram? INCREASE OF TRANSPORTATION COSTS SOURCES MEXICAN PETROLEUM DECREASE LONG DISTANCE Fishbone diagram Cause and effect When identifying possible causes for a problem. Especially when a team’s thinking tends to fall into ruts. TRAFFIC REGULATIONS CHANGES What´s cause and effect diagram? DOLLAR COST The fishbone diagram or cause and effect diagram identifies many possible causes for an effect or problem. It can be used to structure a brainstorming session. It immediately sorts ideas into useful categories. Materials needed: flipchart or whiteboard, marking pens. Methods Machines (equipment) People (manpower) Materials Measurement Environment Write the categories of causes as branches from the main arrow. Brainstorm all the possible causes of the problem. Ask: “Why does this happen?” Write sub–causes branching off the causes. And generate deeper levels of causes indicate causal relationships. Focus attention to places on the chart where ideas are few. TRAFFIC TICKET http://asq.org/learn-about-quality/cause-analysis-tools/overview/fishbone.html http://www.dictionary.com/browse/cause-and-effect https://www.superteacherworksheets.com/causeeffect.html https://www.flocabulary.com/unit/cause-and-effect/ http://examples.yourdictionary.com/cause-and-effect-examples.html Agree on a problem statement (effect). Write it at the center right of the flipchart or whiteboard. Draw a box around it and draw a horizontal arrow running to it. Brainstorm the major categories of causes of the problem. If this is difficult use generic headings: Is useful to analyze process dispersion with this simple, visual tool. The resulting diagram illustrates the main causes and subcauses leading to an effect

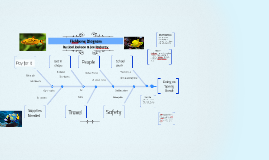
Fishbone Diagram

Transcript: What it looks like Fishbone Diagram Classic fishbone diagram Analyze your diagram. By this stage you should have a diagram showing all the possible causes of your delay / problem. Depending on the complexity and importance of the problem, you can now investigate the most likely causes further. This may involve setting up interviews (see getting patient perspectives), carrying out process mapping or surveys which you can use to decide whether the causes identified are correct. Take each of the main categories and brainstorm possible causes of the problem. Then, explore each one to identify more specific 'causes of causes'. Continue branching off until every possible cause has been identified. Where a cause is complex, you might break it down into sub-causes. Show these as lines coming off each cause line. Patient Re-admission Process-type cause and effect diagram Firstly, identify the problem. Write it in a box and draw an arrow pointing towards it. Think about the exact problem in detail. Where appropriate, identify who is involved, what the problem is, and when and where it occurs. CONTD.... A cause and effect diagram, also known as an Ishikawa, and it is a graphic tool used to explore and display the possible causes of a certain effect. It helps to identify areas for improvement. When causes group naturally under the categories of Materials, Methods, Equipment, Environment, and People Classic Diagram FISHBONE DIAGRAM Visually explanation To show causes of problems at each step in the process. It graphically displays the relationship of the causes to the effect and to each other. When you need help fully understanding an issue and to identify all the possible causes - not just the obvious. If you know the cause of the delay, you are then better placed to implement the solution. Variety of benefits Teach-a-tool It helps teams understand that there are many causes that contribute to an effect Solutions Identify the major factors and draw four or more branches off the large arrow to represent main categories of potential causes. Categories could include: equipment, environment, procedures, and people. Make sure that the categories you use are relevant to your particular problem / delay. When is it used Application to the real world How is it created? Process-type cause and effect diagram Creates a clear understanding

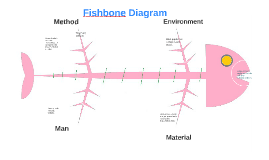
FIshbone diagram

Transcript: Fish bone Communism Russia Backbone Propaganda campaigns to boost the view of the leader, view him as perfect and a saviour. Posters, paintings in homes, huge monuments, statues, parades, shows of strength. Alexander II made many liberal reforms and freed millions of serfs. Unfortunately people struggled with little money after being freed and it was difficult for millions to feed their families. A distaste for capitalism forms. Lenin, Trotsky, Stalin leading the revolution. Nicholas abdicates his throne for a provisional government. The Bolsheviks overthrew it. The Bolsheviks and the Mensheviks fought and the Bolsheviks won, they killed and destroyed the Romanovs’ bodies, this in a way ended all possibilities of a future monarch since it was the end of the bloodline and the bodies were annihilated and all remains thrown in the water leaving no room for a martyr or any way for them to come and pray to their celestially endowed saviors Educate from childhood the correct beliefs, certain films selected to be played in schools and edited as time went on and the party’s beliefs changed. Alexander III made peace with many countries other than a few military expansions. He hung Lenin’s brother, Lenin was hell bent on bringing down the establishment of the monarchy. Music, books films were written and updated to portray soviets as the best (The Battle for Berlin, Days of Glory, North Star) Lenin used some capitalist policies to recover from the civil war with NEP, nouveau riche enjoyed policy and the economy recovered, quickly abolished after Stalin came into power. Success of industrialization silenced all possible protesters internally because no one could deny the economic progress being made. Nicholas II thought that WWI would unite Russia and he could regain the approval of his people. They lost badly, people questioned the army and Nicholas II’s ability to lead. This led to strikes and to the formation of soviets with a simple slogan “Peace...Bread...Land” Secret police (KGB) (NKVD) sending those with alternate ideologies or criticisms of the governments to work camps known as gulags or executing them in order to stop them from spreading their ideas, the spread of any of these new ideas would mean the downfall of the soviet party. Edited pictures of Stalin to not only make him look better but to get rid of his association with traitors or anyone he thought was a threat to power Millions starved through famine by Stalin after trying to reject the collectivist demands set by Stalin by burning crops and killing cattle. Head The consequences of following these ideals came from the lack of government accountability, Stalin's fear of losing the preference of the people and then being executed led him to mass killings of those who he feared were against him No government accountability allowed millions to be put to death through starvation and put to work in gulags. This is because Stalin did not want to lose control over his state; he wanted to quell the rising Ukrainian nationalism, and the Ukranians’ rebellions against Stalin’s imposed collectivism by burning crops and killing cattle. Privacy was sacrificed under the argument of ensuring government accountability and so those who were doing wrong on the part of the party were found out immediately and their executions were made known to serve as a warning to those who would like to follow in their footsteps and as encouragement and hype for those on their side. The economic effects were that the centrally planned economy allowed economic resources to be mobilized and it allowed the country to rise from a point where it was not even up to date with the average european economy to it being close to being on par with the Americans, in terms of not only economy but scientific advancements. The social consequences are in the new attitudes towards those who “don’t work hard” and those who “work hard”. Putting people to work and ensuring people are working is for everyone’s benefit, so the attitudes towards those who don’t work are more hostile than in a capitalist society where those who don’t work don’t have an effect on the whole. Along with these social consequences are the boosts in literacy and education since Russia needed to modernize it needed intelligent people with Russian values to help bring Russia to a point where it is economically on par with the rest of the world to ensure their safety. This meant that there would be huge amounts of education and hospital investments, this ensured that when workers became no longer easily replaceable, that those who were educated would serve the soviet union for a long time. Tail Freed serfs too poor to buy land and even when they borrowed money struggled with loan payments People’s unrest and hunger led to a willingness to accept a rise of a “proletariat” government, one that could understand them, represent the workers and lead their country to a quick industrialization for the better of the country and to fulfill

Now you can make any subject more engaging and memorable