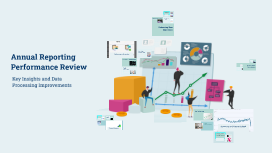
Annual Reporting Performance Review
Transcript: Portal Stability During Peak Times During the entire peak filing period, the Reporting portal maintained complete operational stability. There were no instances of portal outages reported, ensuring a seamless experience for all users. Reduction in Support Tickets User Behavior Analysis The peak filing period saw a drastic reduction in both the number of tickets and voice calls related to user support. Specifically, there was a 50% reduction in tickets and a 25% reduction in voice calls, reflecting improvements in user experience and system performance. Despite a 20% increase in statement filings compared to last year, there have been no noticeable instances of bad user behavior on the Reporting portal. This highlights users' adaptability and continued trust in the system during high-volume filing periods. Enhancing User Experience The analysis shows a significant improvement in user behavior and system stability during peak reporting periods. Notably, the support ticket volume has reduced dramatically, indicating a favorable user experience. Year-on-Year Increase in Filings Performance Overview There has been a 20% increase in statement filings compared to last year. This growth highlights the increasing reliance on the Reporting Portal for submission, reflecting confidence in the platform's capability to manage large volumes of data. The reporting performance has significantly improved over the past year, highlighted by increased filings and exceptional service capacity during peak times. Notably, the system's resilience has ensured a seamless user experience despite a sharp rise in data volume. Successful Service Transactions Database Migration Success Annual Reporting Performance Review The migration processes within the database and Automated Information System (AIS) were executed flawlessly. This seamless transition allowed for real-time data accessibility, supporting over 16,89,75,471 transactions without any delays, ensuring continuity in reporting. During the peak filing period, a total of 32,016 Reporting Entities utilized the functionality, completing 16,89,75,471 transactions effectively. The system exhibited no latency in data processing throughout this busy period, demonstrating its robustness. DQR Generation Efficiency The system demonstrated exceptional efficiency in generating Data Quality Reports (DQRs). These reports were produced promptly, ensuring stakeholders received timely feedback and validation of filings, and maintaining data integrity throughout the peak period. Data Processing Improvements Speed of Data Processing Peak Day Achievements Efficient data processing has been pivotal during the peak filing period, demonstrating a remarkable ability to handle large volumes of information seamlessly. The system has operated without latency, ensuring timely data servicing. During the peak filing period, the speed of data processing was significantly improved, with no latency observed. The processing capabilities were able to handle an unprecedented 38.92 Crore reports filed in a single day, surpassing previous records effectively and efficiently. On May 27, 2024, the Reporting Portal witnessed an unprecedented peak, with 38.92 Crore reports filed in a single day. This achievement surpasses the previous all-time high of approximately 19 Crore reports filed on May 31, 2023. Key Insights and Data Processing Improvements Key Takeaways This reporting cycle has seen a remarkable 20% increase in statement filings compared to the previous year. Notably, during peak times, there were no instances of portal outages, emphasizing the platform's stability and reliability. Additionally, improvements in data processing have allowed for the servicing of over 16.8 million transactions without latency. Ticket Reduction Metrics Voice Call Reduction Statistics Voice calls have decreased by 25% during peak times, showcasing a shift towards self-service solutions. The data indicates that users are finding resolutions through available online resources, thereby alleviating the volume of calls received during critical periods. There has been a significant 50% reduction in the number of support tickets during peak filing periods compared to previous cycles. This indicates improvements in user experience and system stability, reflecting the effectiveness of the escalation management strategies implemented. Overview of Escalation Process The escalation process is designed to provide timely and effective responses to user inquiries and issues. It involves categorizing and prioritizing requests based on urgency, ensuring that critical issues are addressed swiftly. Future Enhancement Areas Summary and Future Outlook To further improve user experience, additional features that streamline the filing process may be integrated. Focus on reducing the total number of support tickets, which decreased by 50%, could involve proactive user support measures. Continued attention on minimizing call volume, which is already at a