You're about to create your best presentation ever

Science Presentation Powerpoint Template

Create your presentation by reusing a template from our community or transition your PowerPoint deck into a visually compelling Prezi presentation.

science powerpoint

Transcript: Undara by Ethan Daley information on place. Undara lava tubes Location: Mount Surprise information of Undara. what is a geologist? A Geologist is a person who does research on rocks, how they are formed, and how they became the way they are now. what is a geologist? What dream time or myths are there? There are no stories on Undara, but stone artefacts and scarred trees were found at Undara and Etheridge Shire. Undara is also an aboriginal word that means long way dream time stories or myths What rocks are at Undara? There are metamorphic and igneous rocks at Undara. Specifically Basalt and Corundum which is a type of sapphire. rocks at Undara extra information The total size of the Undara lava tubes is 615km squared. Semi-evergreen vine thicket grows in the moist, sheltered entrances to some of the lava caves. The roofs of some tubes collapsed, creating ideal conditions for dry rainforest to grow and wildlife to shelter. Rock-wallabies, insectivorous bats and owls roost here in the cool. Birds shelter in the fruit-filled canopy and predators lurk in the tumbled basalt terrain to complete the food chain. extra information on Undara How old is Undara? Undara is around 190,000 years old. Below is a timescale of Undara. age of Undara conclusion My conclusion is that Undara is a cave covered with igneous and metamorphic rocks, which was created by a shield volcano that is no longer active. The Undara Lava Tubes were formed when 23km cubed of lava from one of the many volcanoes spilled out over the land and traveled along a riverbed. The tubes were formed when the outer layer formed a crust which protected the still-molten lava and continued to flow as though it was in a tube or a pipe. It is believed that the entire length of 160km is the longest lava flow from any single volcano on earth. It is estimated that the whole process took between 2-3 weeks with the lava flowing at a rate of around 500m/h. The process that occurred was cooling, and the processes that are probably happening now is weathering and erosion. conclusion

PowerPoint Presentation Template

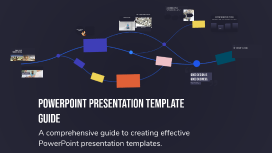
Transcript: Introduction to PowerPoint Designing Effective Slides Importance of Visuals Visuals play a crucial role in retaining information, with studies showing that people remember 80% of what they see compared to just 20% of what they read. Incorporating images, graphs, and diagrams can clarify complex concepts, making them easier to understand and recall. Benefits in Education PowerPoint presentations promote active learning by encouraging interaction and participation. They provide a structured format that helps educators convey information efficiently, making lessons more engaging and memorable for students. Overview of Template Features Choosing the Right Colors Modern PowerPoint templates include various features such as built-in design ideas, customizable layouts, and multimedia integration. These features can streamline the creation process, allowing educators to focus on content delivery rather than design. Typography Best Practices Color choice significantly impacts audience perception and emotional response. Utilize complementary colors for contrast and legibility, ensuring text is easy to read against backgrounds. Consider color psychology while selecting palettes to evoke desired feelings related to your content. User-Friendly Design Elements Effective typography enhances readability and accentuates crucial information. Use no more than two font families, maintain adequate contrast between text and background, and keep font sizes consistent—generally, 24pt for headings and 18pt for body text work best. Animations and Transitions Incorporating Graphics and Images Animations should be used sparingly to avoid distracting the audience. Subtle transitions can guide attention and maintain flow, while key points may be animated for emphasis, helping to engage viewers without overwhelming them. Visuals can reinforce messages and make slides more engaging. Limit image use to enhance rather than clutter, selecting high-quality graphics that support the content and ensure they're relevant to the key points being communicated. Enhancing Audience Engagement Content Structuring Techniques An Educational Resource for Engaging Learning Incorporating Data and Charts Outlining Key Points Q&A Sessions Interactive Elements Incorporating interactive elements like polls, quizzes, and live demonstrations enhances engagement. Research indicates that interactive presentations can increase retention by 50%, making the learning experience more dynamic and memorable. Visual data representation through charts can highlight trends and insights effectively, aiding understanding. Graphs and infographics can convey complex information quickly, making them essential tools for impactful presentations. Clear outlines serve as roadmaps, guiding both presenter and audience through the content. By identifying primary topics and subtopics, speakers can enhance focus and ensure comprehensive coverage of essential material in educational presentations. Q&A sessions facilitate real-time interaction, allowing audience members to address their specific inquiries. This not only clarifies doubts but also fosters a sense of community and open dialogue, increasing audience investment in the material. Feedback Mechanisms Best Practices for Delivery Engaging Storytelling Methods Using Bullet Points vs. Text Implement feedback mechanisms such as surveys or feedback forms post-presentation. This provides valuable insights for improvement and shows the audience their opinions are valued, further enhancing engagement. Effective delivery can significantly boost audience engagement. Key practices include maintaining eye contact, using varied vocal tones, and practicing clear body language to foster a more engaging atmosphere throughout the presentation. Bullet points simplify information, allowing key ideas to stand out without overwhelming the audience. They enhance retention by categorizing concepts, while full text blocks can dilute focus and engagement in presentations. Storytelling captivates audiences, allowing them to relate to the material personally. Incorporating storytelling techniques can enhance emotional connection, making the content more relatable and memorable for learners.

Physical Science Powerpoint Presentation

Transcript: Section 3: Motion and force Accident investigators must apply physics formulas to find out the speed and velocity of vehicles involved in an accident. when an object changes position with respect to a frame of reference,the object is in motion Calculating Acceleration Cars could not move without friction Acceleration and Motion Combined velocities determine the resultant velocity v= d/t the force of friction always opposes motion Why is friction sometimes necessary Unbalanced force do not cancel completely The force of friction Acceleration can be seen on a distance vs time graph Friction and Motion friction is necessary for many everyday tasks to work correctly Chapter: 11 Motion Constant: a quantity whose value does not change Frame of Reference- a system for specifying the precise location of objects in space Force: an action exerted on a body in order to change the body's state of rest or motion; force has magnitude and direction Helpful friction can be increased 3. Motion and Force you can plot a graph showing distance on the vertical axis. Graphing Accelerated Motion instantaneous speed is the speed at a given time kinetic friction: the force that opposes the movement of two surfaces that are in contact and are moving over each other What force always opposes motion Friction and motion Speed and velocity speed: the distance traveled divided by time interval during which motion occured. a= whenever there is a net force acting on an object, the object accelerates in the direction of the net force Velocity is described relative to reference point Acceleration can also be a change in direction Accident investigators inspect car accidents or similar events to see who is at fault and determine how much the insurance company should pay. These forces are the force of gravity, the electromagnetic force, the strong nuclear force, and the weak nuclear force Balanced and unbalanced forces Why It Matters Uniform circular motion has centripetal acceleration Balanced forces do not change motion Chapter Outline v/t What do you need to know to find the speed of an object Fundamental forces Calculating speed How can you study speed by using graphs Key ideas What happens when there is a net force acting on an object Fundamental forces vary in strength How do you calculate the acceleration of an object moving in a straight line Static friction: the force that resists the initiation of sliding motion between two surfaces that are in contact and at rest Graphing Motion What changes when an object accelerates Accident investigators can expect to make between $40,000 and $60,000 a year. speed tells us how fast an object moves, and velocity tells us both the speed and direction the object moves Motion can be studied using a distance v. time graph 1. Measuring Motion Acceleration is the rate at which velocity changes Static friction is greater than kinetic friction Why it Matters Graphing Accelerated Motion 4/16/12 The Force of friction Displacement is the change of an object's position Evidence collected from the scene of an accident can be used to learn about the accident. Accident investigators apply physics formulas to find important information, such as the speed of a vehicle at the time the bakes were applied. A good accident investigator combines information from many sources, including skid marks, vehicle damage and witness statements. The investigator must come up with a theory that matches all evidence. Balanced and unbalanced forces How is a frame of reference used to describe motion Acceleration is negative when slowing down. The slope of a distance vs. time graph equals speed To detect motion you must observe the object relative to it's reference points. When you do you can measure distance the object traveled, displacement, speed, and velocity of the object. Acceleration is a change in speed or direction. To calculate acceleration you need the final velocity minus the initial velocity divided by time. A way to graph acceleration is a speed vs. time graph the slope is acceleration. . When forces are applied and produce a net force of zero they are balanced if the net force is above zero they are unbalanced. The force of friction opposes the motion between two surfaces that are in contact. Friction can be increased or lowered by making surfaces rougher or slick. the average acceleration over a given time interval can be calculated by dividing the change in the object's velocity by time over which change occurs Accident Investigator Friction: the force that opposes motion between two surfaces that are in contact Chapter Summary Acceleration and Motion Calculating Speed Acceleration: the rate at which velocity changes over time; an object accelerates if its speed, direction, or both change over time How can a graph be used to find acceleration Acceleration can be a change in speed Speed and Velocity Graphing Motion Observing Motion what do scientist identify as the fundamental forces of nature Unwanted friction can

PowerPoint Presentation Template

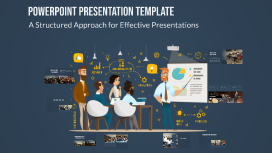
Transcript: PowerPoint Presentation Template A Structured Approach for Effective Presentations Project Title Presentation This presentation outlines the project, including key details such as the presenter's name, roll number, registration number, guide, and the department or institution involved. Questions and Engagement We now open the floor for questions. Your insights and inquiries are valuable for deepening our understanding of the project's implications and findings. Significance of the Project Objective of the Project Problem Addressed This project is significant as it addresses [specific problem], which affects [target population or industry]. By tackling this issue, the project aims to contribute to [specific outcome or field]. The primary objective of this project is to analyze the impact of [specific factor] on [specific area]. This analysis aims to provide insights that can inform future decisions and strategies. The problem addressed in this project is [specific problem statement]. Understanding this problem is crucial for developing effective solutions and advancing knowledge in the field of [related field]. Project Overview Acknowledgments Peer Contributions Funding Support Guide's Contribution I appreciate the collaboration and input from my peers which enriched the research process and findings. Gratitude to [Funding Organization Name] for their financial support that made this project possible. Special thanks to my guide, Dr./Prof. [Full Name], for invaluable guidance and support throughout the project. Correlation Between Variables X and Y Research Methodology The primary outcome of this research indicates a significant correlation between the variables X and Y, suggesting that as X increases, Y also tends to increase. This finding could have implications for future studies in this area. Research Contributions and Future Directions The research highlights significant contributions to the field, addressing critical gaps and providing new insights. Future work will focus on expanding these findings and exploring further applications of the results. 25% Improvement in Performance Metrics Key Findings A secondary finding reveals that the intervention applied improved the performance metrics by approximately 25%, highlighting the effectiveness of the approach taken in this research. Notable Differences and Implications Alignments with Existing Literature Challenges in Data Collection The study also identified several key challenges faced during data collection, including participant engagement and data integrity issues, which may impact the validity of the results and should be addressed in future research. However, some differences were noted, particularly in the interpretation of data and the implications drawn. These divergences highlight the unique contributions of this study and suggest areas for further research and exploration. The findings of this research align closely with previous studies, showing similar trends and outcomes, particularly in areas such as methodology and results. This consistency strengthens the validity of the research and contributes to the existing body of knowledge. Data Collection Methods Qualitative Research Approach Analysis Techniques Data was collected through surveys and interviews, ensuring a diverse range of perspectives. Thematic analysis was used to interpret the data, identifying key themes and patterns relevant to the research question. The research employs a qualitative approach to gain in-depth insights into the topic.

powerpoint template

Transcript: Nobody knows babies like we do! Quality products . Good Customer service. Every Kid really loves this store.. BABYLOU ABOUT US About Us BabyLou was established in 2004. It has been more than a decade since we started, where we have ensured to take care of every need and want of every child and infant under one roof, true to the caption “NO BODY KNOWS BABIES LIKE WE DO”. Our benchmark is to provide 100% customer service and satisfaction and continue to deliver the same with a wide range of toys, garments and Baby Products. Play and Create We Are Best 01 02 03 Block games Building Blocks help Kids to use their brain. PLAY TO LEARN in Crusing Adventures Our Discoveries Enjoy a sunny vacation aboard a luxury yacht with the LEGO® Creator 3in1 31083 Cruising Adventures set. This ship has all the comforts you need, including a well-equipped cabin and a toilet. Sail away to a sunny bay and take the cool water scooter to the beach. Build a sandcastle, enjoy a picnic, go surfing or check out the cute sea creatures before you head back to the yacht for a spot of fishing. Escape into the mountains Disney Little Princes in Also available for your Babies..... Also... Out of The World… Our reponsibility BABYLOU…. Our Responsibility All children have the right to fun, creative and engaging play experiences. Play is essential because when children play, they learn. As a provider of play experiences, we must ensure that our behaviour and actions are responsible towards all children and towards our stakeholders, society and the environment. We are committed to continue earning the trust our stakeholders place in us, and we are always inspired by children to be the best we can be. Innovate for children We aim to inspire children through our unique playful learning experiences and to play an active role in making a global difference on product safety while being dedicated promoters of responsibility towards children.

Now you can make any subject more engaging and memorable