Flow Diagram
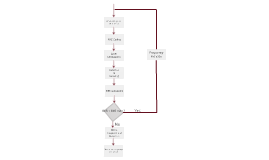
Transcript: Assets Flow Diagram Understanding Processes Through Visual Representations Comment Arrows and Flow Direction Different Types of Flow Diagrams Arrows in flow diagrams indicate the direction of process flow, guiding the viewer through sequential steps. The thickness and style of arrows can signify the strength of the connection or the nature of the relationship between different steps. Various types of flow diagrams serve distinct purposes, including process flow diagrams, data flow diagrams, and workflow diagrams. Each type caters to different aspects of system representation, aiding in comprehension of complex processes. Introduction to Flow Diagrams Flow diagrams are essential tools for visually representing processes, enhancing understanding and communication within a variety of fields. Their structured formats aid in clarifying complex workflows. Tools for Designing Flow Diagrams Best Practices in Diagram Construction Definition of Flow Diagrams Applications of Flow Diagrams There are numerous tools available for creating flow diagrams, including Microsoft Visio, Lucidchart, and Draw.io. These tools offer templates, drag-and-drop functionality, and collaborative features to streamline the diagram creation process. To enhance effectiveness, ensure that flow diagrams are simple and uncluttered. Use standardized symbols, maintain consistent flow directions, and limit the number of process steps to enhance understanding. Regularly revise diagrams to keep them up-to-date with any process changes. Symbols Used in Flow Diagrams Flow diagrams are visual representations of processes, displaying steps in sequential order. They utilize various symbols and arrows to illustrate the flow of actions, decisions, and data throughout a system. Flow diagrams are used across various sectors, including business, healthcare, and software development. They assist in mapping out processes, diagnosing issues, and enhancing operational efficiency. Steps to Create a Flow Diagram Importance of Flow Diagrams Begin by identifying the process to be diagrammed. Gather input from stakeholders, define the start and endpoint, and list out the key steps involved. Use symbols consistently to represent different actions, decisions, and flows for clarity and comprehension. Flow diagrams utilize standardized symbols such as ovals for start and end points, rectangles for processes, diamonds for decision points, and parallelograms for inputs/outputs. Each symbol communicates specific information, ensuring that viewers can quickly grasp the process dynamics. Creating a Flow Diagram Flow diagrams simplify complex information, making it accessible and understandable. They facilitate effective communication among team members and stakeholders, promoting clarity in project management and process improvements. Components of Flow Diagrams Flow diagrams are essential tools for visualizing processes. This section outlines the steps, tools, and best practices for creating effective flow diagrams, ensuring clarity and functionality. Flow diagrams rely on specific symbols and structures to convey processes clearly. Understanding these components is essential for creating effective diagrams that enhance visual communication and understanding. Business Process Flow Diagram Analyzing Flow Diagrams Examples of Flow Diagrams Business Process Flow Diagrams map out the steps of organizational workflows. They illustrate roles, responsibilities, and the sequence of tasks, leading to greater efficiency and clarity in operations. Effective analysis of flow diagrams is crucial for optimizing processes, enhancing efficiency, and facilitating systematic improvement. This section focuses on evaluating efficiency, identifying potential bottlenecks, and formulating strategic improvements based on diagram analysis. Future Trends in Flow Diagram Usage Flow diagrams serve as powerful visual tools to illustrate processes across various fields. This section presents specific examples, showing how flow diagrams can enhance understanding and efficiency in business, software development, and healthcare. Case Studies and Applications The integration of AI and automation in flow diagrams is anticipated to enhance real-time process analysis. Future applications will focus on dynamic diagrams that adjust based on ongoing project changes, significantly improving adaptability and efficiency. Improvement Strategies Evaluating Process Efficiency Analyzing real-world applications of flow diagrams demonstrates their effectiveness in enhancing organizational efficiency and process clarity. Examining successful implementations, stakeholder feedback, and emerging trends provides valuable insights into the future of flow diagrams in various sectors. Healthcare Process Flow Diagram Strategic improvements based on flow diagram analysis can include reallocating resources, restructuring processes, or implementing automation. Continuous feedback loops and regular assessments promote sustained