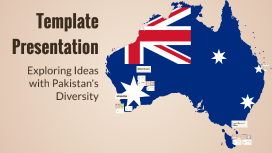
You're about to create your best presentation ever

Market Presentation Template

Create your presentation by reusing one of our great community templates.

Market Summary Template

Transcript: Average Quoted Rates ($/SF) Source: Reis Source: CoStar vacancy rate under construction Net Absorption (Units) Average Quoted Rates ($/SF) 2Q 2015 Source: Reis vacancy rate Source: CoStar delivered to the market The only delivery in 2015 has been 1K Fulton, the 689,067 SF creative/loft office conversion from an industrial cold storage facility. 4.0% Average Quoted Rates ($/Unit) St. Louis Metropolitan Area (C$B) average asking rate St. Louis Office Market 2Q 2015 0 SF Commercial Real Estate Fundamentals Quoted asking rates have yet to fully recover from recessionary lows and Power Centers have been hit especially hard. PWC Market Position RGA Loan Exposure 807k SF Overall, 47 bps drop year over year and small uptick from previous quarter. 7.2% St. Louis Apartment Market Source: CoStar 3.5 MSF New construction remains healthy and is primarily build-to-suit driven with very little speculative projects. Office Market St. Louis New Retail space is coming online but at a significantly slower pace than historical averages. Net Absorption (SF) Vacancy Rate (%) Quoted asking rates have recovered from recessionary lows but have yet to make any meaningful long term gains. Industrial Market Source: CoStar Unemployment Rate Drops 120 bps YOY under construction average asking rate Deliveries (SF) 842k SF Office Market - Expansion Stage 1 Industrial Market - Recovery Stage 1 Apartments - Expansion Stage 3 Retail Market - Recession Stage 3 Source: CoStar Apartment Market St. Louis Metropolitan Area Retail Market 2018 Political segmentation of cities and counties promotes competition and incentive bidding wars and not a common market goal 2016 Old and aging infrastructure Source: Reis Strengths 1.1 MSF Trade, Transportation, and Utilities lead the pack combined positive net absorption over previous 4 quarters Source: CoStar Source: CoStar Market Summary 175k SF Overall, 95 bps drop year over year and no from previous quarter. Huge talent pool; strong roster of well regarded education institutions Source: CoStar Unemployment had decreased 112 basis points to 5.5 percent in May from 6.2 percent in May of last year. Gains, albeit modest gains, are being made across many office-using sectors including professional and business services and trade, transportation and utilities. Along with this growth the housing market also moved towards full recovery. With employment numbers improving, the real estate market can expect to see more demand as companies expand their footprint. Deliveries (SF) Overall, 10 bps drop year over and small uptick from previous quarter. Source: CoStar PWC Market Position 10.8% Net Absorption (SF) Rapid, new construction has caused speculation in the market that the product type has neared its peak. Net Absorption (SF) Deliveries (Units) Source: CoStar Employment Drives Demand Slow population growth restrains job growth 2015 Average Quoted Rates ($/SF) Weaknesses Source: Reis Deliveries (SF) Strong start for the Chicago industrial market posting nearly 1.0 MSF for the 1st Quarter 2017 vacancy rate combined positive net absorption over previous 4 quarters Strengths & Weaknesses Office Market - Expansion Stage 3 Industrial Market - Recovery Stage 2 Apartments - Contraction Stage 2 Retail Market - Recovery Stage 1 7.3% 2Q 2015 average asking rate Source: CoStar Source: CoStar asking rate Source: CoStar $4.11 PSF 911k SF Quoted asking rates have maintained consistent historical growth and barely dipped in 2009 during the recession. $17.96 PSF Consistent, positive absorption. Major buildings delivered during the 1st Quarter include Corporate Center Bldg C, 752 KSF & 100% leased, and Liberty Business Center, 430 KSF & 0% leased. Quoted asking rates have recovered from recessionary lows but have yet to make any meaningful long term gains. 2Q 2015 Under Construction (SF) The St. Louis economy will progress this year with strong emplyment gains, which will lead to residential demand. Demand will come from new employees migrating into St. Louis and by the un-bundling of existing households as wages begin to rise and the unemployment continues to decline. The St. Louis apartment market lags slightly behind the national apartment market. The market is currently in the third stage of expansion and is projected to move into the second stage of contraction by 2017 and 2018. The US apartment market is currently in the second stage of contraction and is projected to move into the third stage my 2016 and remain there through 2018. Affordable housing and cost of living compared to other large cities Vacancy Rate (%) under construction Slow start for Chicago office market leasing as the market thaws from Winter. Source: CoStar Source: CoStar Source: CoStar St. Louis 2Q 2015 Snap Shot Overall, 58 bps drop year over and no change from previous quarter. Under Construction (SF) Office Market - Expansion Stage 2 Industrial Market - Recovery Stage 1 Apartments - Contraction Stage 1 Retail Market - Recession Stage 3 Source: Reis

Presentation Template

Transcript: Designing Your Presentation Structuring Content Effectively Color Schemes and Fonts Choosing the Right Layout Incorporating Visuals and Graphics A clear structure is vital for effective presentations. The rule of three can be applied, presenting ideas in groups of three for easier digestion. Use bullet points and numbered lists to enhance clarity and flow. Color schemes set the mood and enhance readability. A limited palette of 2-3 colors with contrasting tones is more effective. Choose fonts that align with the presentation tone; sans-serif for modern looks and serif for traditional presentations are common choices. The layout determines visual hierarchy and readability. Common layouts include slides designed for text-heavy content versus those emphasizing visuals, such as images or infographics. A well-structured layout improves audience retention of information. Visuals, such as images and charts, capture attention more than text alone. Research shows that visuals can improve information retention by up to 65%. Infographics help in simplifying complex data for better understanding. Introduction to Research Topic Templates serve as a blueprint for presentations, providing consistency in design and structure. They save time and ensure that crucial elements are not overlooked, enhancing overall communication and engagement with the audience. Components of a Good Template A good presentation template includes essential elements such as a title slide, content layout, visual hierarchy, and consistent color schemes. Each component must work together to enhance readability and visual appeal, guiding the audience through the information seamlessly. Types of Presentation Templates There are various types of presentation templates including pitch decks, educational lectures, and marketing presentations. Each type is tailored to specific communication needs and audience expectations, ensuring clarity and relevance of the content. Best Practices for Presentations Visual Aesthetics in Templates Visual aesthetics, including color theory and typography, play a crucial role in presentation templates. Effective use of visuals can capture attention, reinforce messages, and promote retention, making the information more impactful. Relevance of the Current School Curriculum to future job market Demands Engaging Your Audience To capture attention, incorporate storytelling, relevant anecdotes, and interactive polls or questions. Research shows that audiences are 75% more likely to remember presentations that include interactions. Timing and Pacing Utilizing Technology and Tools Leverage tools like PowerPoint, Prezi, or interactive platforms such as Mentimeter for effective visuals and engagement. Utilizing technology not only makes your content more dynamic but also enhances understanding across diverse learning styles. Effective presentations balance content with timing. Aim for 1 minute per slide on average and leave time for questions; experts recommend 10-15% of total time for Q&A to enhance understanding and engagement. Handling Questions and Feedback Encourage questions by allocating specific time for audience interaction and demonstrating openness. Implementing a structured Q&A format can improve clarity and allows for deeper audience engagement while addressing common misconceptions. Conclusion and Next Steps Resources for Further Learning Recap of Key Points For those looking to refine their presentation skills, consider books like 'Presentation Zen' by Garr Reynolds and online courses on platforms such as Coursera or LinkedIn Learning. These resources offer advanced techniques and strategies for effective communication. Essential components of effective presentations include understanding your audience, utilizing engaging visuals, and structuring content for clarity. A well-designed template can significantly enhance the presentation experience for both the presenter and the audience. Call to Action for Practice Final Thoughts on Presentation Skills Mastering presentation skills not only enhances professional opportunities but also boosts personal confidence. Remember, effective communication is a key asset in any field, making it essential for career advancement. Regular practice is vital for mastery in presentations. Engage in public speaking groups like Toastmasters or seek opportunities to present at work to build confidence and receive constructive feedback.

Presentation Template

Transcript: Assets Presentation Template Creating Effective and Engaging Presentations Comment Color Schemes Color schemes impact perception and engagement. Utilizing complementary colors enhances readability and evokes emotional responses, while a consistent palette promotes professionalism and cohesiveness throughout the presentation. Why Are Presentations Important? Key Elements of a Good Presentation An effective presentation consists of clear objectives, engaging content, appealing visuals, and strong delivery. These elements work together to ensure the message is understood and retained by the audience. Presentations are a vital tool for conveying ideas and information in a concise manner. They help engage audiences, facilitate knowledge sharing, and support decision-making in various contexts, from business to education. Font Selection Storytelling Techniques Common Presentation Formats Using Data and Statistics Crafting a Compelling Conclusion Choosing the right fonts ensures readability and visual appeal. Sans-serif fonts are generally preferred for digital presentations, while contrasting font styles for headings and body text can enhance clarity. Introduction to Presentations Presentations can take various formats, including slideshows, verbal talks, and interactive workshops. Each format serves specific purposes and can be chosen based on the audience's needs and the presenter's objectives. A strong conclusion summarizes key takeaways and reinforces the significance of your message. Present a call to action, encouraging the audience to reflect or act upon the information, leaving a lasting impression. Understanding the essential features of effective presentations is crucial for successful communication. This section covers the importance of presentations, the key elements that make them effective, and how to tailor your message to your audience. Storytelling in presentations makes content relatable. Use personal anecdotes or case studies to illustrate points, weaving emotional connections that resonate with your audience and aid in memory retention of key messages. Incorporating relevant data strengthens your arguments and adds credibility. Utilize visuals like charts and graphs to present complex information clearly, ensuring that statistics are contextualized and connected directly to your overall narrative. Understanding Your Audience Setting Clear Objectives Visual Hierarchy Image Usage Creating Engaging Headlines Knowing your audience is crucial for tailoring your message effectively. Factors such as demographics, interests, and expertise level should inform the presentation's content and style for maximum impact. Defining clear objectives is essential for any presentation. Objectives guide the content and keep both the presenter and audience focused on the intended outcomes, ensuring effective communication. Visual hierarchy prioritizes information to guide the audience's focus. By varying font size, weight, and color, key points are emphasized, allowing for quicker understanding of the presented material. Images should complement the content, not overwhelm it. High-quality visuals can illustrate complex ideas, but maintaining relevance and context is crucial for impactful communication. Headlines serve as hooks to capture your audience’s interest. Craft headlines that are concise yet compelling, leveraging impactful words to convey the essence of each section, encouraging further engagement with the content that follows. Layout and Spacing Structuring Your Presentation Content Development Effective layout and spacing guide the audience's eye. Proper alignment and ample white space can enhance readability, prevent overcrowding, and create a more polished, professional appearance. A well-structured presentation enhances clarity and retention. Consider using a clear beginning, middle, and end, supplemented with transitions that guide the audience through your key points. Utilize frameworks like the Problem-Solution or Chronological approach depending on your topic. Effective content development is the backbone of any successful presentation. It involves careful structuring and engaging communication to ensure your message is understood and retained. Design Principles Effective design principles are fundamental for creating engaging presentations that hold the audience's attention. Understanding visual hierarchy, color schemes, font selection, image usage, and layout ensure that messages are conveyed clearly and professionally. Managing Nervousness Learning from Past Presentations Nervousness is common among presenters; techniques such as deep breathing, visualization, and practice can effectively manage it. Creating a clear structure for the presentation can also boost confidence and promote calmness during delivery. Incorporating Multimedia Reviewing recordings of past presentations can illuminate patterns in performance. This reflection enhances understanding of effective techniques and common

Market Study Template

Transcript: Technology Market Study Prezi Prezi was selected to be utilized in this course because it allows the presentation to be customizable and flow freely as desired by the creator. It visually illustrates relationships between concepts, creating an engaging presentation for learners. It also could have up to 8 users working on a presentation at one time (Settle, 2011). How will it be used in the course? Create presentations for the course Used for collaborative work with instructional designers and learners Create work that is automatically saved Used for it minimal cost Convert PowerPoint slides into Prezi presentation Canva Canva is a very popular technology tool that is utilized in various industries. One of Canva’s top benefits is having hundreds of templates for hundreds of different projects. How will it be used in the course? Create infographics, flowcharts, job aids, text graphics, and other graphics Create professional high-level graphics Use it because it is more affordable then other graphic applications on the market (Adobe photoshop or illustrator) Some basic visual design principles Canva video Screencastify Screencastify is a user-friendly video technology application that can be downloaded with Google as a chrome extension. It is easily accessible and provides closed captioning that can be turned on during the video editing process. How will it be used in the course? Record videos to explain directions for asynchronous lessons Create videos that can be edited with simple tools Use because it is not overly intimidating as a video technology Easy and quick video recordings Articulate 360 studio “Deliver presentation-based courses to every device—without tweaking a thing. You simply create your course with Studio 360, then click publish. Your course automatically plays beautifully on every device your learners happen to use” (Articulate, 2022). How will it be used in the course? Effective outline course for learners Create lessons that offer a variety of interactive tools Creation of easy and stratight foward assessments Create easy to navigate, user friendly course Wix “Discover Wixs’ platform that gives you the freedom to create, design, manage and develop your web presence exactly the way you want” (Wix, 2022). How will it be used in the course? Create website as a model presentation Create a website that is customizable Use more versatile and advanced technology tools can be integrated into site Use as a tool for learners to create mock lessons to build their knowledge

Presentation Template

Transcript: Overview of the Topic This presentation highlights the significance and relevance of the topic, setting the stage for a deeper understanding of its impact and importance in the current context. Foundational Elements Understanding the foundational elements of the topic is essential for grasping its complexities. These elements may include definitions, key terms, and underlying principles that guide the subject matter. Diverse Perspectives Key Points of Discussion Identifying the different perspectives and theories surrounding the topic enables a deeper analysis of its impact and relevance. This includes examining various viewpoints and their contributions to the field. Presentation Template Implications and Relevance Recognizing the implications of the topic on current practices and future developments is crucial. This involves understanding how the topic influences ongoing trends and potential changes in the field. Historical Developments of the Topic This timeline highlights significant events and milestones that have shaped the evolution of the topic over time. 1980s 2000s 1900s Key innovations emerged, transforming the landscape and leading to widespread adoption. Significant technological developments facilitated new approaches and methodologies. Initial theories and concepts regarding the topic were introduced, laying the groundwork for future exploration. 1950s 2020s Major advancements in research led to a better understanding and broader applications. Current trends are reflective of ongoing research, highlighting the importance of sustainable practices. A structured outline for effective presentations Major Milestones 2018 - Global Initiative 1990 - Foundational Event 2010 - Technological Advancement 2005 - Legislative Change The year 2018 saw a pivotal change marked by a global initiative that united stakeholders towards a common goal. In 1990, the first significant event related to this topic set the foundation for future developments. In 2010, a major technological advancement revolutionized practices related to the topic, leading to increased efficiency. The introduction of a key legislation in 2005 transformed how the topic was approached across industries. Q&A Session In-depth Responses Encouragement for Questions Value of Audience Feedback Responses will be provided to ensure understanding and promote further discussion. Participants are encouraged to ask questions to clarify any aspects of the presentation. Feedback from the audience will be valuable for future presentations and improvements. Traditional Marketing Digital Marketing Sustainability Focus Impact of Emerging Technologies Rise of Interdisciplinary Collaboration Traditional marketing includes methods such as print, television, and radio advertisements. It often targets a broad audience and relies on established channels, which can make it more recognizable but less measurable in terms of response rate. Digital marketing, on the other hand, encompasses online strategies including social media, email campaigns, and content marketing. It allows for targeted messaging and precise analytics, enabling marketers to tailor campaigns based on real-time data and audience behavior. Sustainability will increasingly influence decision-making processes, as organizations prioritize eco-friendly practices and long-term viability. Emerging technologies are expected to play a pivotal role in shaping future developments, driving innovation, and transforming existing practices within the field. Interdisciplinary collaboration will be essential for tackling complex challenges, leading to more innovative solutions and enhanced outcomes. Future Directions Summarizing Key Takeaways and Their Implications This slide encapsulates the essential insights gained from the presentation, emphasizing their relevance and potential impacts on future practices and understanding.

Now you can make any subject more engaging and memorable