You're about to create your best presentation ever

Funnel Chart Template Powerpoint

Create your presentation by reusing a template from our community or transition your PowerPoint deck into a visually compelling Prezi presentation.

Medical PowerPoint Template

Transcript: Medical PowerPoint Template Design Elements Color Schemes for Medical Presentations Font Selection for Readability Color schemes significantly affect audience understanding and retention. In medical presentations, using blue and green hues promotes calmness and trust, while contrasting colors can highlight key information and enhance visibility. Choosing the right font is crucial for comprehension. Sans-serif fonts like Arial or Helvetica are recommended as they are easier to read on screens. Always ensure that text is large enough to be legible from a distance. Incorporating Graphics and Images Layout and Structure Incorporating relevant graphics can enhance understanding and retention of complex ideas. Use high-quality images, charts, or diagrams that directly relate to the content to support the narrative without overcrowding the slide. A well-structured layout guides the audience’s eye and improves information flow. Utilize a grid system to maintain alignment and consistency, making sure to reserve space for visual elements. Balance text with images to avoid clutter. A Blank Canvas for Your Data Presentation Tips Best Practices for Delivery Content Organization in Medical Presentations Engaging Your Audience Practicing your presentation can lead to smoother delivery and reduced anxiety. Utilize appropriate body language, voice modulation, and eye contact to foster a connection with the audience, making your message more impactful. Audience engagement is critical for effective communication. Techniques include asking rhetorical questions, using relatable examples, and incorporating multimedia elements to maintain interest and encourage participation. Title Slides and Headings Introduction to Medical Presentations Title slides set the stage for your presentation and should include the topic, your name, and the date. Headings throughout the presentation guide the audience through the narrative and facilitate smooth transitions between topics, ensuring clarity and focus on key messages. Bullet Points vs. Paragraphs Handling Questions and Feedback Bullet points provide concise and digestible pieces of information, making it easier for the audience to follow along. In contrast, paragraphs may be necessary for complex concepts but should be used sparingly to maintain attention and avoid overwhelming the viewer. Practicing and Timing Your Presentation Using Tables and Charts Tables and charts effectively present quantitative data, making complex information more approachable. They facilitate quick understanding of trends and relationships within data, enhancing the audience’s ability to interpret clinical findings or statistical results. Rehearse your presentation multiple times to refine your delivery and timing. Understanding how long each section takes helps ensure that you cover all material without rushing or exceeding your allotted time. Encourage questions to create a dialogue with your audience. Responding thoughtfully to feedback shows respect for their input and enhances clarity for everyone involved, improving overall comprehension. Citing Sources and References Importance of Visual Aids Citing sources is crucial in maintaining credibility and allowing the audience to explore further. Proper referencing not only attributes the original work but also strengthens arguments presented in the medical content, supporting evidence-based practice. Visual aids play a crucial role in medical presentations by simplifying complex information. They help audiences grasp essential concepts quickly, improving retention and engagement through the use of charts, images, and videos. Overview of PowerPoint Features PowerPoint offers various features to enhance medical presentations, including templates specifically designed for medical content, the ability to incorporate multimedia, and options for animations that can illustrate processes or changes over time. Objectives of the Medical Template The medical PowerPoint template serves to streamline the creation of presentations by providing a standardized format. This ensures consistency in design and aids users in organizing their data effectively for clarity and impact.

Organization Chart Template

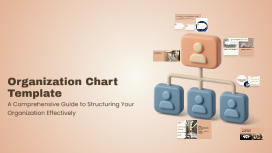
Transcript: Organization Chart Template A Comprehensive Guide by Selina Bohn Introducing the Organization Chart Template by Selina Bohn This presentation outlines the Organization Chart Template designed to clarify and streamline organizational structures. It emphasizes the template's importance in enhancing communication and efficiency within teams, making it a pivotal tool in various organizational settings. Maximize Organizational Clarity with Our Template The Organization Chart Template by Selina Bohn serves as an essential resource for improving communication and efficiency within your organization. Its user-friendly design and customizable features allow teams to visualize their structure effectively, fostering collaboration and streamlined decision-making. User-Friendly Design Clear Visual Representation of Hierarchy Customizable Elements The template is designed with simplicity in mind, making it easy for users to navigate and create their organizational charts without any technical expertise. The template visually outlines the hierarchy within an organization, allowing for quick understanding of roles and reporting relationships, which aids in clarity and communication. Users can easily modify colors, fonts, and layout to align with their organization's branding and preferences, ensuring a personalized touch. Key Features of the Template Versatile Applications of the Organization Chart Template Highlighting its effectiveness across various sectors over time. 2022 2023 2020 Implemented in non-profit organizations to define organizational hierarchy and enhance volunteer coordination, leading to greater operational efficiency. Now utilized across various sectors, including healthcare and technology, to support organizational development and improve workflow processes. The template was first introduced in corporate settings, streamlining organizational structures and enhancing communication among teams. 2021 Adopted by educational institutions to clarify roles and responsibilities among faculty and staff, improving organizational transparency. Benefits of Using the Template Adjusting Visual Elements Modifying Organizational Structure Users can easily modify the appearance of the Organization Chart Template by adjusting colors and fonts. This allows for personalization to align with organizational branding or individual preferences, ensuring that the chart is both visually appealing and representative of the organization’s identity. Additionally, the template provides straightforward options for adding or removing team positions. This flexibility enables organizations to maintain up-to-date representations of their structure, accommodating changes in personnel or roles as needed. Improves Team Collaboration Enhances Communication Clarity Streamlines Organizational Planning Clear visual hierarchies help all team members understand roles and responsibilities, reducing confusion and enhancing communication effectiveness. Fosters better teamwork by providing a shared understanding of team dynamics and reporting structures, enabling more efficient collaboration on projects. Facilitates strategic planning by visually mapping out the organization, allowing leaders to identify gaps and allocate resources more effectively.

Editable PowerPoint Template

Transcript: Editable PowerPoint Template Guiding Principles for Effective Presentations Design Principles Introduction to Editable Templates Consistency in Style Color Schemes and Branding Maintaining a consistent style throughout a presentation reinforces the brand image and enhances comprehension. Consistent elements, such as color, fonts, and layouts, help the audience follow the narrative without distractions. A well-chosen color scheme can evoke specific emotions and create a memorable experience. Aligning color choices with branding principles ensures recognition and reinforces your message effectively across all slides. Visual Hierarchy and Layout Definition and Purpose Font Selection and Readability Establishing a clear visual hierarchy guides the viewer's attention to the most critical information. Effective layout techniques, such as balancing text and images, can ensure that key points stand out in your presentation. Overview of PowerPoint Benefits Editable templates are pre-designed formats that allow users to modify content, layout, and design. Their primary purpose is to save time and maintain consistency in presentations across different topics and audiences. Choosing the right fonts is crucial for readability and engagement. Sans-serif fonts are generally preferred in presentations due to their clean lines, while limiting the number of font types maintains visual clarity. PowerPoint simplifies the presentation creation process through intuitive tools and features, such as templates, animations, and multimedia integration. Its widespread use ensures compatibility, making it accessible for diverse audiences. Importance of Editable Formats Examples of Use Cases Editable formats promote collaboration among team members, allowing multiple users to contribute to a single presentation without confusion. They enhance adaptability to specific audience needs, ensuring relevant and impactful communication. Editable templates can be applied in various scenarios, including corporate training sessions, educational lectures, and marketing presentations. They help to tailor content to specific objectives while maintaining a professional appearance. Content Guidelines Structuring Your Narrative Incorporating Data Visualizations Use charts and graphs to represent complex data simply, making it easier for the audience to grasp key points. Ensure visualizations are labeled correctly, providing context to avoid misinterpretation. Organize content logically, beginning with a clear introduction, followed by key points and a strong conclusion. Each section should transition smoothly to maintain audience engagement and ensure key messages are memorable. Effective Use of Text and Images Engaging Your Audience Customization Tips Balance text and visuals to enhance understanding, ensuring that images complement and reinforce the message rather than distract. Limit text on slides to key phrases to promote clearer communication and retention. Use interactive elements such as polls, questions, or discussions to foster audience participation and create a dynamic atmosphere. Understanding your audience and addressing their interests can significantly enhance engagement levels. Adding Multimedia Elements Altering Templates for Your Needs Customize templates to reflect your unique branding and message. Adjust colors, fonts, and layouts to better align with your content's theme and improve audience engagement. Take advantage of template features to create a distinct visual identity. Incorporate videos, audio clips, and animations to create dynamic presentations. Multimedia can significantly enhance the storytelling aspect, making information more compelling and easier to retain for your audience. Saving and Sharing Templates Best Practices for Adaptation After customization, save templates in accessible formats for future use. Use cloud services for easy sharing among team members, ensuring everyone has the most up-to-date version to maintain consistency in presentations. When adapting templates, keep the audience's needs and perceptions in mind. Use feedback to refine designs and ensure your modifications serve the original purpose while enhancing clarity and effectiveness.

Organization Chart Template

Transcript: Organization Chart Template A Comprehensive Guide to Structuring Your Team Effectively Final Thoughts on Organization Chart Templates An organization chart template serves as an essential visual tool for clarifying the structure and dynamics of an organization. Implementing best practices, such as regular updates, clarity in design, and consistent formatting, will maximize its effectiveness and utility. Understanding the Organization Chart Template An organization chart template visually depicts the hierarchical structure of an organization, illustrating the roles, responsibilities, and interrelationships among various positions. It serves as an essential tool for clarity in organizational dynamics. Steps to Create an Organization Chart An organized approach to building an effective organization chart. Step 2 Step 3 Step 4 Step 1 Gather information about the organization’s structure, including job titles, employee names, and reporting relationships. Choose a suitable organization chart template that meets the needs of the organization and its structure. Input the gathered data into the template, ensuring all information is accurate and relevant. Finalize the design by reviewing for clarity and effectiveness, ensuring it visually communicates the organizational structure. Clarifies Organizational Hierarchy Key Components of an Organization Chart Organization chart templates clarify the hierarchy within an organization, making it easier for employees to understand their place and role in the structure. Identifies Reporting Relationships Benefits of Using an Organization Chart Template These templates identify reporting relationships, allowing employees to know who to approach for various queries and decisions, thereby streamlining workflow. Employee Names Job Titles Reporting Lines Enhances Communication Including names of employees personalizes the chart, allowing for easy identification of who holds each position. Lines connecting positions illustrate reporting relationships, clarifying the hierarchy and flow of authority within the organization. Job titles clearly define each role within the organization, helping to establish expectations and responsibilities. Matrix Structure Hierarchical Structure Utilizing an organization chart template enhances communication by providing a visual guide that helps in understanding roles and responsibilities, fostering collaboration among team members. Matrix organization charts present a more complex structure, where employees have multiple reporting relationships, often across different projects or departments. This format facilitates collaboration and flexibility, allowing for efficient resource allocation and communication across teams. Hierarchical organization charts illustrate a clear top-down structure, where authority flows from the top levels of management down to lower levels. This traditional format helps define roles and responsibilities distinctly, making it easier for employees to understand reporting relationships.

PowerPoint Presentation Template

Transcript: PowerPoint Presentation Template A Structured Approach for Effective Presentations Project Title Presentation This presentation outlines the project, including key details such as the presenter's name, roll number, registration number, guide, and the department or institution involved. Questions and Engagement We now open the floor for questions. Your insights and inquiries are valuable for deepening our understanding of the project's implications and findings. Significance of the Project Objective of the Project Problem Addressed This project is significant as it addresses [specific problem], which affects [target population or industry]. By tackling this issue, the project aims to contribute to [specific outcome or field]. The primary objective of this project is to analyze the impact of [specific factor] on [specific area]. This analysis aims to provide insights that can inform future decisions and strategies. The problem addressed in this project is [specific problem statement]. Understanding this problem is crucial for developing effective solutions and advancing knowledge in the field of [related field]. Project Overview Acknowledgments Peer Contributions Funding Support Guide's Contribution I appreciate the collaboration and input from my peers which enriched the research process and findings. Gratitude to [Funding Organization Name] for their financial support that made this project possible. Special thanks to my guide, Dr./Prof. [Full Name], for invaluable guidance and support throughout the project. Correlation Between Variables X and Y Research Methodology The primary outcome of this research indicates a significant correlation between the variables X and Y, suggesting that as X increases, Y also tends to increase. This finding could have implications for future studies in this area. Research Contributions and Future Directions The research highlights significant contributions to the field, addressing critical gaps and providing new insights. Future work will focus on expanding these findings and exploring further applications of the results. 25% Improvement in Performance Metrics Key Findings A secondary finding reveals that the intervention applied improved the performance metrics by approximately 25%, highlighting the effectiveness of the approach taken in this research. Notable Differences and Implications Alignments with Existing Literature Challenges in Data Collection The study also identified several key challenges faced during data collection, including participant engagement and data integrity issues, which may impact the validity of the results and should be addressed in future research. However, some differences were noted, particularly in the interpretation of data and the implications drawn. These divergences highlight the unique contributions of this study and suggest areas for further research and exploration. The findings of this research align closely with previous studies, showing similar trends and outcomes, particularly in areas such as methodology and results. This consistency strengthens the validity of the research and contributes to the existing body of knowledge. Data Collection Methods Qualitative Research Approach Analysis Techniques Data was collected through surveys and interviews, ensuring a diverse range of perspectives. Thematic analysis was used to interpret the data, identifying key themes and patterns relevant to the research question. The research employs a qualitative approach to gain in-depth insights into the topic.

powerpoint template

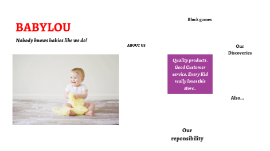
Transcript: Nobody knows babies like we do! Quality products . Good Customer service. Every Kid really loves this store.. BABYLOU ABOUT US About Us BabyLou was established in 2004. It has been more than a decade since we started, where we have ensured to take care of every need and want of every child and infant under one roof, true to the caption “NO BODY KNOWS BABIES LIKE WE DO”. Our benchmark is to provide 100% customer service and satisfaction and continue to deliver the same with a wide range of toys, garments and Baby Products. Play and Create We Are Best 01 02 03 Block games Building Blocks help Kids to use their brain. PLAY TO LEARN in Crusing Adventures Our Discoveries Enjoy a sunny vacation aboard a luxury yacht with the LEGO® Creator 3in1 31083 Cruising Adventures set. This ship has all the comforts you need, including a well-equipped cabin and a toilet. Sail away to a sunny bay and take the cool water scooter to the beach. Build a sandcastle, enjoy a picnic, go surfing or check out the cute sea creatures before you head back to the yacht for a spot of fishing. Escape into the mountains Disney Little Princes in Also available for your Babies..... Also... Out of The World… Our reponsibility BABYLOU…. Our Responsibility All children have the right to fun, creative and engaging play experiences. Play is essential because when children play, they learn. As a provider of play experiences, we must ensure that our behaviour and actions are responsible towards all children and towards our stakeholders, society and the environment. We are committed to continue earning the trust our stakeholders place in us, and we are always inspired by children to be the best we can be. Innovate for children We aim to inspire children through our unique playful learning experiences and to play an active role in making a global difference on product safety while being dedicated promoters of responsibility towards children.

Now you can make any subject more engaging and memorable