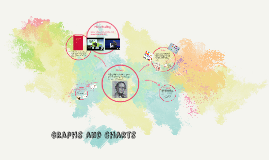
You're about to create your best presentation ever

Free Powerpoint Templates Charts And Graphs

Create your presentation by reusing a template from our community or transition your PowerPoint deck into a visually compelling Prezi presentation.

Graphs and Charts

Transcript: Data Visualization/ Information Design Trendalyzer - Hans Rosling - Line Graph - Bar Chart - Pie Chart/ Circle Graph William Playfair, a Scottish engineer and political economist created the idea that data could be presented to the masses (1759-1823) "helping people see without words" -Tufte Till this day, many, cite from his book Commercial and Political Atlas, and consider it The Bible: a ancient and revered book that is often cited but rarely read. Other Innovators in the field a non profit, that promotes sustainable global development and achievement of the United Nations Millennium Development Goals by increased use and understanding of statistics and other information about social, economic and environmental development at local, national and global levels. Graphs and Charts History a software which animates data. Charts and graphs have evolved into other forms known as infographics or Information Graphics - graphic visual representations of information, data or knowledge intended to present complex information quickly and clearly. Hans Rosling, a Swedish medical doctor, academic, statistician and public speaker/ storyteller. He is Professor of International Health at Karolinska Institute and co-founder and chairman of the Gapminder Foundation, which developed the Trendalyzer software system. Edward Tufte who is known as a pioneer in the field of data visualization and information design. (Princeton) http://www.npr.org/2013/01/18/169708761/edward-tufte-wants-you-to-see-better Experts: John Tukey (Alma Mater Brown University 1936) who came up with the FFT algorithm and Box Plot. Storytelling, and graphs, and visual data, OH MY! ...and created diagrams, known to us as: Today

Charts and Graphs

Transcript: I am here to talk about all different kinds of graphs since I did a terrible job on the charts in my excel assignment :(( Vertical Pie of Pie Line Graphs A pie chart compares parts to a whole. The entire pie represents the total data set and each segment of the pie is a particular category within the whole. Pie Charts A chart is a graphical representation of data. Charts are often used to ease understanding of large quantities of data and the relationships between parts of the data. Charts can usually be read more quickly than the raw data that they are produced from. Scatter Graph An area chart emphasizes the magnitude of change over time. So recently there is a movie called Life of Pie Useful to show trends or correlations over a period of time. You can only use line graphs when the variable plotted along the x-axis is continuous – for example, time, temperature or distance. A graph of plotted points that shows the relationship between two sets of data. 3D Scatter Graph by Yee Ling Cheung All You Need To Know About Charts The known value goes on the x-axis and the measured (or "unknown") value on the y-axis. For example, if you were to plot the measured average temperature for a number of months 2 Types of Bar Charts Bar Charts Horizontal The Basics This is a pie chart with user-defined values extracted and combined into a second pie. Area Graphs The data you are measuring must depict a ratio or percentage relationship. Use the same unit of measure within a pie chart. Otherwise your numbers will mean nothing. (SAME DENOMINATORS!!!!) What is a Chart/Graph? Why use it? Pie Charts A bar/column chart shows data changes over a period of time or illustrates comparisons among items. Almost has the same purpose of line graphs. Difference in that line graphs must use continuous data, while data in bar graphs could be discontinued. A scatter plot is used when a variable exists that is under the control of the experimenter. You have independent and dependent variables.

CHARTS AND GRAPHS

Transcript: LINE GRAPH BAR CHARTS PIE CHARTS illustrate comparisons in trends it is often use to visualize a trend in data over intervals of time - a time series- thus the line is often drawn chronologically chart that presents Grouped data with rectangular bars with lengths proportional to the values that they represent they can be plotted vertically or horizontally A vertical bar chart is sometimes called a column bar chart When you are interpreting figures, look first for general patterns; terms such as the majority, twice as many,the same (as) approximations such as almost, nearly, approximately, (just) over/under specify three verbs which can be used to describe an upward trend? what can the line graph provide? did you ever use any of this graphs? if you did, for what? Wednesday, January 27, 2016 $1.25 LINE GRAPHS PIE CHARTS GRAPHICS a circular statistical graphics, which is divided into slices to illustrate numerical proportion the arc length of each slice is proportional to the quantity it represents they are very widely used in the business world and the mass media Understanding visual information show specific trends in data, often on a time line compare percentages of a whole piece of data BAR CHARTS type of chart wich displays information as a series of data points called "markers" connected by straight line segments Makar Lorena Marinić Doris CHARTS AND GRAPHS In your writing present statistical and numerical data in graphics form for clarity Refer to the graphics and describe the overall patters rather than all the statistics in detail

Charts and Graphs

Transcript: 1st- Freedom of religion, speech and the press; rights of assembly, and petition 2nd- Rights to Bear Arms 3rd- Not to house soldiers 4th- Search and Arrest Warrants 5th- Rights in Criminal Cases 6th- Rights to Fair Trial 7th- Rights in Civil Cases 8th- Bails, Fines, and Punishments 9th- Rights Retained by the People 10th- Powers Retained by the States and by the People Popular Sovereignty-The people establish government and are the source of its power. Limited Government- Gocernment powers are restricted to protect individual rights. Seperation of powers- The power to govern is divided among executive, legislative, and judicial branches to prevent the concentration and abuse of power by any one branch. Checks and balances- Each branch of the government has the authority to check, restrain, some powers of the other two branches. Judicial Review- The judiciary has the power to strike down laws and other government actions as invalid under the constitution. Federalism- The rights of the states are protected by dividing powers between the national government and the state governments. Congress can propose and amendment with two thirds vote in each house Amendments can also be proposed by national convention called by the congress with two-thirds voteof the state legislature Amendments can be ratified with the vote of three-fourths of the states Amendments can also be ratified with convention in three-fourths of the states Executive- has the ability to veto acts of Congress, call special sessions of congress, can suggest laws and send messages to congress, appoints federal judges, and can grant reprieve and pardons for federal crimes. Legislative- can impeach nad remove the president, can overide veto, controlls spending of money, approves or regects certain presedential nominations, must ratify all forml us treaties, can impeach and remove federal judges, and establishes lower federal courts. Judicial- can declare acts of congress unconstitutional throught judicial review, can declare executive acts unconstitutionaland judes are appointed for life and are free of executive controll. Nichole Bennett Bill of Rights Federalists Seperation of Powers Need for a strong central government to guard us from foreign dangers to be a guardian for commerce Need power to tax For protection James Madison, John Adams, and Alexander Hamilton GOAL! Anti-Federalists Charts and Graphs Principles of the Constitution Amending the Constitution opposed the constitution, unless changes were made Claimed central government was going to be to strong Claimed the power of the states would be desroyed Worried that power hungery people would take over the cental government The power to govern belongs to the people and should be cautios to give it up Patrick Henry, Thomas Jefferson, and George Mason Demanded to add a Bill of Rights to protect the individual

Now you can make any subject more engaging and memorable