You're about to create your best presentation ever

Fishbone Analysis Powerpoint Template

Create your presentation by reusing a template from our community or transition your PowerPoint deck into a visually compelling Prezi presentation.

PowerPoint Simple Fishbone Diagram Template

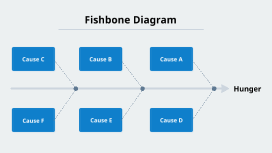
Transcript: Effective Problem Analysis Use this fishbone diagram template to present the root causes of issues clearly and effectively. It is ideal for scenarios that require a structured analysis of factors affecting performance or outcomes. Minimal Text for Maximum Impact When to Use This Template This template supports minimal text usage, enhancing the focus on key points and making complex information more accessible to the audience. Versatile Application in Business and Education The fishbone diagram is especially useful in business and educational contexts for identifying underlying issues and creating actionable solutions, making presentations more effective. Understanding the Fishbone Diagram The fishbone diagram, also known as the Ishikawa or cause-and-effect diagram, is a visual representation that systematically categorizes potential causes of a problem. It facilitates root cause analysis by organizing these causes into distinct categories, enhancing clarity in identifying underlying issues. Visual Segmentation Streamlined for Clarity Each segment of the fishbone is visually distinct, guiding the audience's attention toward relevant written content. This design helps in making complex relationships easier to understand at a glance. The fishbone diagram is designed for clarity, allowing for a focused presentation of information. Its streamlined structure enhances the flow of communication, ensuring that key points stand out effectively. Segment Breakdown of the Fishbone Diagram Understanding the components that contribute to problem analysis. PowerPoint Simple Fishbone Diagram Template Text One Text Two Text Three Text Four Text Five Text Six Text Seven Text Eight Discusses the fourth factor, emphasizing the relationships among different components. Covers the fifth factor, linking it to previous elements for a comprehensive view. Identifies the first factor affecting the issue being analyzed, providing initial insights. Highlights the second factor, adding depth to the analysis and facilitating further discussion. Explores the third factor, illustrating its impact on the overall problem and solutions. Illustrates the sixth factor, providing additional context for the ongoing evaluation. Examines the seventh factor, reinforcing the connection to the overall theme of the fishbone diagram. Concludes with the eighth factor, summarizing its relevance to the analysis at hand. Minimized Text for Clarity Highlighting Key Points A streamlined approach to analyzing causes and effects in business and education using a minimalistic fishbone diagram. The fishbone diagram's design promotes clarity by minimizing text, allowing the audience to focus on essential information. Versatile Applications of the Fishbone Diagram The fishbone diagram serves as an effective tool across diverse sectors such as business and education. It assists teams in pinpointing root causes of challenges, fostering effective problem-solving approaches, and streamlining operational processes, ultimately enhancing performance and decision-making. Summarizing the Fishbone Diagram's Impact The fishbone diagram is an essential analytical tool that simplifies complex problems by categorizing causes, fostering clarity and engagement. Its visual format enhances understanding, making it ideal for effective presentations. The inclusion of a Q&A session further allows for clarification and deeper discussion of the identified issues.

Fishbone Analysis

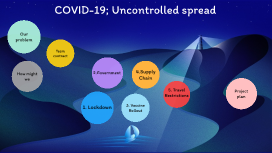
Transcript: COVID-19; Uncontrolled spread Our problem Why has the UK suffered significantly from the Covid 19 pandemic? Problem: The number of cases of Covid-19 in the UK has significantly increased after border restrictions and isolation measures were lifted. Our problem Team contract Individual Skill Sets: Jacinta - Presentation skills Frida - Problem solving skills Hannah - IT design skills Alex - Organisation skills Allegra - Research skills Harry - Public speaking skills Team contract Shared Goals: 1. Achieve desired grades 2. Expand individual skill sets 3. Learn from peers Team Processes Strength & Direction of our team: Highly people orientated Strongly performance orientated Considerably learning orientated Individual Roles: Hannah and Alex linked up on the Fishbone Analysis, Jacinta completed the Project Plan, Frida and Harry collaborated on the How Might We deliverable and I (Allegra) completed the Team Contract. Team Processes Defining our problem How might we The Coronavirus pandemic, initially being discovered on the 1st of December 2019, has significantly impacted the entire world. Covid-19 is caused by exposure to an infectious viral agent, which is responsible for an acute respiratory illness which is highly contagious, and evidently in some infected people; its lethal. Understanding this cause is essential for our group, as this leads directly into the problems faced by nations today, revealing our problem we face. Our group undertook an examination of the problems arisen from the Covid-19 pandemic, and narrowed the major issue present to be the absence of effective quarantine and isolation methods. Other problems, such as; - supply chain complications -logistics issues, -economic stress, -poor vaccine rollouts, -travel restrictions, -trade bans These all stem back to the problem overseeing all of these issues, which is isolation and quarantine. Understanding, analysing --> give a definition to our problem. (narrow down our problem + how might we?) · Before solution diamond -- Make sure: vision / the goal of the problem. complex problem (covid) -- Decide which specific direction we are focusing on, In case - team members focus on different information · In the solution diamond -- political tension. go back to referencing the vision to have a positive creative abrasive process. Why define the problem Brainstorm Discussion Implementation of bio-security -- enables countries to remain economically sound. Reasons: · control the pandemic in a shorter period of time, · being able to resume trading at full capacity quickly. · Give large pharmaceutical businesses enough time -- manage their vaccine rollouts -- ensure their vaccines have passed efficacy targets. How important it is to implement the bio-security. How are we going to find the solution Our problem is a simple one to address. - Some nations have found the solution. - Some have not adopted the fundamental principles of biosecurity. <-- They have paid the price as a result. So how might we? Our group will; Given that the number of cases in the UK has significantly increased due to poor implementation of biosecurity, how might we analyse the successes of countries who have effectively managed the pandemic. How might we learn from this information, and develop a solution which can be applicable for the United kingdom which has poorly managed the spread of the disease. And how might we utilise this research to apply it to the wider world managing further pandemics. Lockdown precautions Lockdown effectiveness: Jan 4 2021 national lockdown: 81,000 cases daily (Dec 29) to 39,000 (Jan 19) 1. Lockdown Ineffectiveness: (overall) UK ranks 5th worldwide for COVID deaths (124,501) and number of cases (4,218,520) Inconsistent public health message Government's health measures - Unorganised strategy: Delayed implementation of social distancing - Boris Johnson's advisor travelled 500 miles during lockdown - December: Gov announced relaxing of lockdown laws for christmas (whilst new variant was spreading) "Government's public health messaging has been inconsistent" "It all comes down to failed leadership" - Time Resource scarcity Police patrol - Not enough officers to effectively patrol lockdown - Mass gatherings can't be broken up (not enough resources to ticket everyone) Eg. Nov 2020: Illegal rave with 700 people --> "incredibly challenging operation" --> 2 people arrested Government 2.Government Ineffective management - higher death rates Legislation awareness Implementation of legislation Lockdown laws: (eg) - 2 metre social distancing - Gatherings of more than 30 people face a £10,000 fine National chair of police federation: - Police found rapidly changing legislation difficult to follow Underfunding Scarce funding & resources -Inadequate funding in social care (discharging people without testing, inadequate protective equipment) --> deaths of thousands of elderly -Death rates higher among minority groups: “suffered disproportionately because of health Vaccine

Fishbone Analysis Project

Transcript: Project Overview Background of Fabrik ‘Locale Fabrik ‘Locale by Black Woman Market aims to enhance operational efficiency through automation. The current reliance on manual sales data compilation is time-consuming and error-prone, highlighting the need for a more efficient system. Current Sales Reporting Process Objective of Automation The existing sales reporting involves manual data collection and processing each month. This method presents challenges including time constraints and a high likelihood of errors due to human oversight during data entry. The project aims to develop a system that automates sales data collection and report generation. This will enable more accurate and timely analyses, facilitating better decision-making for business growth. Fishbone Analysis Fishbone Analysis Project Tasks Completed Scenarios and Observations Fabrik ‘Locale currently relies on manual collection and processing of sales data, which is both time-consuming and error-prone. The existing process involves raw data in French, necessitating translation, further complicating operations and introducing potential misunderstandings. Potential Automation Solutions Three potential solutions were identified: utilizing Microsoft Access integrated with Excel for data management, implementing cloud-based tools like Power BI or Tableau, or developing a custom script/app for automating downloads from Square. Each option presents unique advantages tailored to the organization's needs. Challenges in Manual Data Processing The manual processing of sales data leads to multiple challenges, including increased duration for report generation, risk of errors during data entry, and difficulties in interpreting translated data. Additionally, the inconsistencies in currency formatting add complexity to the reporting process. Access to Software Raw Data Collection Data Download Selected Solution: Microsoft Access with Excel Integration Downloaded the required transaction data in line with the client’s specifications, allowing for tailored reporting outcomes. Ensured that the data was relevant and up-to-date for analysis. Collected raw sales data from the client, ensuring all relevant information was captured for further processing. This set the foundation for accurate reporting and analysis. Gained access to Square, the client's primary sales software, to extract essential transaction data needed for creating comprehensive reports. This access was crucial for automating the reporting process. The chosen solution, Microsoft Access with Excel integration, is user-friendly and allows for structured database creation. This approach can efficiently handle historical data, generate slicer-based reports, and improve overall reporting accuracy while being cost-effective for the organization. Excel Data Transfer Visualization Using Slicers Database Preparation Transferred structured data from Microsoft Access to Excel, enabling further analysis. This process provided flexibility for visualization and reporting tools utilized in the project. Utilized Excel Slicers to present different product categories, enhancing the report’s visual appeal and usability. This feature allowed users to interactively filter data for deeper insights. Created a Microsoft Access database to store and manage the raw sales data effectively. This structured database facilitated easier data manipulation and reporting. Historical Data Access Issues and Considerations Created an Access database inclusive of historical data from January 2024 to February 2025, enabling trend analysis over time. This capability supports informed decision-making based on past sales performance. Language Translation Implications Integration Process Challenges The sales data collected is primarily in French, which necessitates translation and adds complexity. Manual translation increases the risk of data misinterpretation, potentially leading to inaccurate reporting and decision-making. The integration of Microsoft Access with Excel may result in format mismatches and compatibility issues. These challenges could arise from the different ways each software manages data structures and historical records, necessitating careful planning to ensure seamless integration. User Training Requirements Data Consistency and Formatting Thank you! - Group 5 THANK YOU! Questions? - Group 5 Automating Sales Reporting for Fabrik ‘Locale by Black Woman Market Post-deployment, users may lack training to maintain the automated system effectively. Comprehensive training is necessary to ensure all staff are capable of utilizing new software tools and addressing unexpected issues. Ensuring consistent currency formatting and alignment between systems is crucial. Discrepancies in data structure from Square to Access/Excel templates may lead to reporting inconsistencies or errors in analytics.

Now you can make any subject more engaging and memorable