You're about to create your best presentation ever

Data Science Project Presentation Background

Create your presentation by reusing one of our great community templates.

Data Science Presentation

Transcript: Overview Predicting Breast Cancer Survival and Treatment Outcomes Using Clinical and Genetic Data Goal: Develop predictive models for breast cancer outcomes using METABRIC dataset. Dataset: 1,980 primary breast cancer samples including demographics, tumor characteristics, treatment types, survival outcomes, mRNA expression levels, and gene mutations. Methodology: Data acquisition and preprocessing (cleansing, EDA, dimensionality reduction). Gene expression analysis to identify potential biomarkers. Machine learning algorithms: Logistic Regression, Random Forest, SVM. Focused on the top 20 genes with the most patients. Social or Ethical Implications Privacy and Data Security: Ensure protection of patient data. Ethical Use: Avoid discrimination or stigmatization based on genetic profiles. Access Disparities: Ensure equal access to personalized treatments for all patients. Informed Consent: Maintain transparency and trust with patients. Bias in Models: Address biases to ensure fair and accurate predictions for all groups. Runeem Al-Abssi, Avie Burris, Camille Anderson Findings Figures Recommendations Significant Genes: rad51c, psen2, jag1, and hdac1 correlated with breast cancer prognosis. Gene Expression Impact: Variability in gene expression levels affects survival outcomes. Treatment Response: Varied based on genetic and clinical profiles. Complex Interactions: Between gene mutations, expression levels, tumor size, and patient age. Conclusion Personalized Treatment Plans: Tailor treatments based on genetic and clinical profiles. Targeted Gene Therapy: Investigate genes like rad51c, psen2, jag1, and hdac1 for new treatments. Enhanced Predictive Models: Incorporate more genomic data and advanced algorithms. Clinical Decision Support: Use predictive models in clinical systems to aid treatment decisions. Success: Demonstrated the usefulness of machine learning in predicting breast cancer outcomes using integrated clinical and genetic data. Key Insights: Identified significant biomarkers and treatment factors to support personalized treatment strategies. Impact: Potential to enhance prognostic accuracy and advance precision medicine in oncology. Future Work: Incorporate additional genomic data and explore more advanced machine learning models to further refine predictions and improve clinical decision-making. Goal: Improve patient care and outcomes through better understanding and tailored treatment approaches.

Data Science Presentation

Transcript: Data Scientist Interview What I Learned The Basics Dr. Singh started out at The Fed Economic Research Data Cleaning Linear and Logistic Regression Went back to school and got her doctorate in data science Now works at google as a data scientist with the YouTube Comments team The Interview Interview Process 1. Screening Call with an HR Rep. to determine the best role for you (could be different than what you applied for) 2. Technical Interview to cover your general statistical and coding knowledge (there are 4 in total) 3. Behavioral interview to asses the parts of you that don't have to do with your technical ability 4. Then everything you've done so far goes through multiple committees to make sure everything's up to snuff 5. You then get to interview other hiring managers to figure out what team you want to work with Dr. Singh said the whole process took 8 week Day To Day Day to Day For Dr. Singh her job is unique in a way that her department is full of data scientists but they all work with different product segments She works primarily with the YouTube comments team where she works closely with the software engineers and product managers Her day to day mainly contains meetings with the software engineers and product managers of the YouTube comments team to determine what they need while the rest is spent coding She best describes it as being an internal consultant who does what ever they need done, small, medium, and large, when it comes to data science Languages and Technologies Commonly Used Technologies It mainly depends on what team shes working with SQL, R, Python with a little bit of C++ are all used. Data scientists don't need to know all of these but at least at google SQL is needed because its the primary way they interact their databases Its hard to get as much support for R because only 50 of the 3000 people working with YouTube are data scientists. Dr. Singh says she has a preference for R for data analysis but is trying to move towards python for the reason stated above. Knew most of the technologies going in (had to touch up on C++ and SQL) but Google has dedicated time every quarter for learning on the Job Favorite Project Favorite Project? One of her first projects The comments team had a metric they wanted to use but the data for it was extremely noisy Dr. Singh developed a method that improved the usable data by 300%. She was able to fully implement her work in a way that it was essentially plug and play for the comments team to use. It required no changes to their current codebase. The reason she enjoyed it so much was the fact that she got to use a bunch of different languages, learned a bunch of new stuff, and in the end got to wrap it up in a nice neat package that was actually useful. Current and Future Projects Recent Projects A survey after you watch a video that lets you pick between and rate 2 different comments as to which one is more relevant. Researching the correlation between Engagement signals and user satisfaction Currently working on how to detect brigaiding and notify the creator as its happening so they can disable comments and protect themselves. This involves determining what metrics are indicative of brigaiding (dislikes, mass comments, etc) Random Information Fun Facts and Random Information Her office has a slide in it to get down stairs Google hosts YTF (YouTube Fridays) where you can talk with coworkers outside of a work environment as well as talk with the YouTube CEO in a relatively relaxed environment. She also mentioned there is awesome live music. She's only had to work outside of work once and her boss was mad that it even happened at all. She said while its extremely uncommon for data science stuff to be deadline focused but it might be a little different for software engineers. "When getting your PHD you learn how to learn" Took a shotgun approach to applying for jobs (Chase Bank, Post Doc at Yale, Social Policy Think Tank, Lawrence Liver more National Lab, and many more) Advice for younger self "Stop trying to plan so much, just let go a bit, everything will be okay".

Data Science Presentation

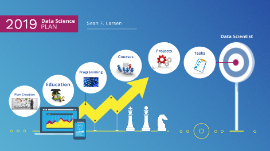
Transcript: PLAN Data Scientist 2019 Sean F. Larsen Data Science Plan Creation Plan Creation Education Programming Skills Course Projects Tasks Education Education Statistics Statistics Basics Statistics Statistical Methods Regression Analysis Probability and Distribution Theory Statistical Regression and Inference Analysis Analysis Predictive Analysis Inferential Analysis Causal Analysis Mechanistic Analysis Decision Making Data Skills Data Skills Subject Selection Data Mining Data Cleaning Data Exploration Data Presentation Data Presentation Data Visualization Story Telling With Data Programming Programming Courses Courses Projects Projects 5 Types of Data Science Projects 5 Types Importing data Joining multiple datasets Detecting missing values Detecting anomalies Imputing for missing values Data quality assurance Exploratory Data Analysis Exploratory Data Analysis Ability to formulate relevant questions for investigation Identifying trends Identifying correlation between variables Communicating results effectively using visualizations Interactive Data Visualization Interactive Visualization Including metrics relevant to your customer’s needs Creating useful features A logical layout (“F-pattern” for easy scanning) Creating an optimum refresh rate Generating reports or other automated actions Reason why you chose to use a specific machine learning model Splitting data into training/test sets Selecting the right evaluation metrics Feature engineering and selection Hyperparameter tuning Machine Learning Machine Learning Know your intended audience Present relevant visualizations Don’t crowd your slides with too much information Make sure your presentation flows well Tie results to a business impact Communication Communications First 5 Projects First 5 Continued Work Continued Work Tasks Tasks Data Science Resume Data Science LinkedIn Profile Apply for Jobs Start a Blog Update My GitHub Account Update My Pinterest Account

Background Data

Transcript: Concept Map 4 Acetaminophen/1000mg/q6h/oral/for pain Bisacodyl/10mg/once a day/rectal/for constipation d/t required bedrest Enoxaparin/36mg/q12h/sub-q/to prevent clot formation d/t bilateral below the knee casts requiring bed rest Fluoxetine/30mg/nightly/oral/to treat depression Labs & Results Age: 15 Allergies: NKA Medical Diagnosis/Reason for admission: Bilateral ankle fracture d/t attempted suicide jump out of 2nd story windwo after ingesting "handful of corcidin." Reported loss of consciousness upon fall. Pertinent medical and surgical history: H/o depression, anxiety. Suicide attempt in March. Raped a few years ago-mom not aware (does not want mom to know). This will affect patient care and education because if the patient lacks good mental health, she is less likely to adhere to given instructions and more likely to continue to perform self-inflecting harm. Birth data: No data available. Erickson's Developmental Stage: Identity vs Role Confusion This is currently affecting the patient because she is trying to find where she fits in the world and displays confusion as to what her role is in this moment in time. Psychologist Erik Erikson said that this exploration is part of a psychosocial crisis, where adolescents have to find themselves otherwise if they stay in role confusion, they will feel dissatisfied and have trouble figuring out what they want out of life- which is what this patient has struggled to find. Background Data Physical Assessment Medications (Name/Dosage/Frequency/Route/Rationale) Nursing Diagnosis 1. Risk for self-harm r/t previous history of prior suicide attempt Goals: -Pt will not harm self during duration of hospital stay and upon follow-up visit -Pt will maintain connectedness in relationships for 2 weeks following discharge Interventions: -Be alert for warning signs of suicide: making statements such as, “I can’t go on,” “Nothing matters anymore,” “I wish I were dead”; becoming depressed or withdrawn; behaving recklessly; getting affairs in order and giving away valued possessions; showing a marked change in behavior, attitudes, or appearance; abusing drugs or alcohol; suffering a major loss or life change. -Question family members regarding the preparatory actions mentioned.Communicate the degree of risk to family and caregivers; assess the family and caregiving situation for ability to protect the client and to understand the client’s suicidal behavior. Provide the family and caregivers with guidelines on how to manage self-harm behaviors in the home environment.. -Before discharge from the hospital, ensure that the client’s parent has a supply of ordered medications, has a plan for outpatient follow-up, has a caregiver who understands the plan or is able and willing to follow the plan, and has the ability to access outpatient treatment. 2. Powerlessness r/t physical limitations and dependence on others to meet basic needs Goals: -Pt will demonstrate increased feelings of control over his/her situation -Pt will participate in self-care activities within physical limitations and prescribed activity restrictions Interventions- -Assess for behaviors that may indicate feelings of powerlessness (e.g. verbalization of lack of control over self-care or current situation, anger, irritability, passivity, lack of participation in self-care or care planning). -Evaluate client's perception of current situation, strengths, weaknesses, expectations, and parts of current situation that are under his/her control. Correct misinformation and inaccurate perceptions and encourage discussion of feelings about areas in which there is a perceived lack of control. -Support realistic hope about probability of future independence and ability to resume usual roles and lifestyle. -Include client in the planning of care, encourage maximum participation in the treatment plan, and allow choices whenever possible to promote a sense of control. -Encourage significant others to allow client to do as much as he/she is able so that a feeling of independence can be maintained. Ackley, B., & Ladwig, G. (2014). Nursing diagnosis handbook. Maryland Heights, Mo.: Elsevier. All immunizations are up to date. Pt denied flu vaccine before discharge. From 10/25- last day they were recorded -RBC: 3.42 (4.1-5.3)/ Low d/t recent bilateral ankle surgery and current Lovenox medication -Hematocrit: 27.7% (35-45)/ Low d/t recent bilateral ankle surgery and current Lovenox medication -Hemoglobin: 9.0 (12-15)/ Low d/t recent bilateral ankle surgery and current Lovenox medication -Platelets: 598 (150-450)/ High d/t inability to excercise as a result of bilateral below the knee casts requiring bed rest Social Work Services: Mom wanted to be called by a social worker because she had questions regarding discharge since she will not make it before then. -Pulse: 89 bpm/ 2+(Normal)/ Location- Radial, RUE -O2: 99% intermittent, room air -RR: 17 per min -BP: 109/53 (L arm sitting) -Temperature: 36.9 C -Pain: 0/10 (Numeric Scale) -General

Data Science Presentation

Transcript: Bar Charts Line Graphs Bar charts are effective for comparing discrete categories, allowing viewers to easily see variations in size and frequency across different groups. They are particularly useful for representing counts or frequencies of categorical data. Line graphs are ideal for showing trends over time, making it easy to visualize changes in data points across intervals. They are commonly used for time-series data to depict how a variable evolves. Applications of Data Science Healthcare Innovation Marketing Strategy Enhancement Sports Performance Analysis Financial Services Optimization In marketing, data science enables targeted campaigns and customer segmentation, enhancing engagement and conversion rates by analyzing consumer behavior and preferences. In healthcare, data science improves patient outcomes through predictive analytics and personalized medicine, revolutionizing treatment plans and patient care. Financial institutions leverage data science for risk assessment, fraud detection, and automated trading strategies, enabling smarter financial decisions and increasing profitability. Sports teams utilize data science for performance analysis, player scouting, and game strategy development, leading to improved team performance and fan engagement. Data Privacy Concerns Data privacy concerns arise from the need to protect sensitive information, as mishandling data can lead to serious legal and ethical implications for organizations. Need for High-Quality Data Challenges in Data Science High-quality data is crucial for accurate analysis and decision-making. Poor data quality can lead to misleading insights and ineffective strategies. Complexity of Algorithms The complexity of algorithms can pose challenges in implementation and interpretation, requiring skilled professionals who can navigate intricate data models. Understanding Machine Learning Machine learning, a key aspect of artificial intelligence, allows systems to automatically improve their performance through experience. By analyzing large datasets, these systems can uncover hidden patterns and make informed predictions without explicit programming for every task. Summarizes Data Characteristics Exploratory Data Analysis (EDA) not only summarizes the data but also helps in forming hypotheses for further analysis. It is a critical step in the data analysis process, allowing analysts to gain insights before applying more formal modeling techniques. Utilizes Visual Methods Importance of Exploratory Data Analysis Visualizations such as histograms, box plots, and scatter plots are essential tools in EDA, as they provide a graphical representation of data distributions and relationships, making it easier to spot outliers and trends. Identifies Data Quality Issues EDA is beneficial for identifying data quality issues, such as missing values or incorrect data entries. By understanding the data's structure and properties, analysts can prepare the dataset for more complex analyses. Future Trends in Data Science Key developments shaping the future of data science and its applications. 2025 2023 Real-time data analytics is transforming decision-making processes, providing immediate insights to businesses. Automated machine learning tools are becoming more accessible, enabling non-experts to leverage AI. 2024 Ethical AI practices are being adopted across the industry to ensure responsible data usage and algorithm transparency. Data Science: A Crucial Evolving Field Data science plays a critical role in helping organizations make informed decisions through data-driven insights. Its continuous evolution necessitates that organizations stay updated and adapt their strategies to fully harness its capabilities for better outcomes and innovation. Machine Learning Improves Predictions AI Enhances Decision-Making Transforming Industries Artificial Intelligence (AI) utilizes algorithms and statistical models to analyze and interpret complex data, enabling machines to perform tasks that typically require human intelligence. Machine learning, a subset of AI, allows systems to learn from data, continually improving their accuracy in making predictions or decisions without being explicitly programmed. AI technologies are transforming industries by automating tasks, personalizing user experiences, and generating insights from vast amounts of data, making them essential in today’s digital economy. AI Presentation Artificial Intelligence in Data Science An Overview of Data Science Concepts, Techniques, and Applications Understanding Data Science Data science merges various disciplines, including statistics, computer science, and domain expertise to analyze data effectively. It employs methodologies to derive actionable insights from both structured and unstructured datasets, making it essential in today’s data-driven world. Informed Decision-Making Data science plays a vital role in informed decision-making, allowing organizations to analyze data trends and make

Now you can make any subject more engaging and memorable