You're about to create your best presentation ever

Capnography Powerpoint Templates

Create your presentation by reusing a template from our community or transition your PowerPoint deck into a visually compelling Prezi presentation.

CAPNOGRAPHY

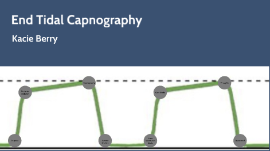
Transcript: - Used by anasthesiologists since 1970's -Standard of care in the OR since 1991 Capnography is the monitoring of the concentration or partial pressure of carbon dioxide (CO2) in the respiratory gases. Its main development has been as a monitoring tool for use during anesthesia and intensive care. It is usually presented as a graph of expiratory CO2 (measured in millimeters of mercury, "mmHg") plotted against time, or, less commonly, but more usefully, expired volume. The plot may also show the inspired CO2, which is of interest when rebreathing systems are being used. FUTURE BREAKTHROUGH DISCUSSION FUNCTIONS AND APPLICATIONS design by Dóri Sirály for Prezi DIAGNOSTIC USAGE TECHNICAL OPERTAION -Oxygenation and ventilation are distinct physiologic functions that must be assessed in both intubated and spontaneously breathing patients. -Capnography became a routine part of anesthesia practice in Europe in the 1970s and in the United States in the 1980s. -Registered Nurses in critical care settings use capnography to determine if a nasogastric tube, which is used for feeding, has been placed in the esophagus as opposed to the trachea. HISTORICAL ACCOUNT MEDICAL SERVICES Capnography is a well-studied technology in anesthesia and has been used in the operating room for more than 35 years. USE IN Anesthesia CAPNOGRAPHY is the continuous non-invasive monitoring of exhaled carbon dioxide, and is essential for the measurement of adequacy of ventilation (breathing). By detecting changes in ventilation immediately as they happen, clinicians are alerted to potential respiratory problems before they become a serious threat to the patient. No other measure is as fast or effective as Capnography to monitor the breathing process and reduce the risk to patients of unrecognized, lifethreatening respiratory distress, which is the leading cause of preventable deaths in hospitals. CAPNOGRAPHY

Capnography

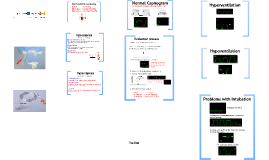
Transcript: The End 1. Is there CO2 present? (any waveform) Normal 35-45mmHg Hypocapnea less than 35mm/Hg Hypercapnea more than 45 mm/Hg Air leak around ET tube Patient is blowing off more CO2 than is making during metabolism. Hyperventilation syndrome Esophageal intubation Blood does not return to the lungs to exchange gases. Uneven or "shark fin" plateau is uneven alveolar emptying. Curved plateaus are secondary to bronchospasm in conditions such as an asthma attack. Sedation wearing off from RSI. Patient attempting to breath on their own. C 0 metabolism is slowed in hypothermic state Problems with Intubation (compensation for metabolic conditions such as DKA) B 2. Look for rebreathing. You will see a breath to breath increase in the respiratory baseline. 4. Look at the alveolar expiratory plateau. Should be flat. Ventilatory failure blood pH drops below 7.35 causes problems with oxygen binding and off loading to cells. Normal 35-45mmHg Hypocapnea less than 35mm/Hg Hypercapnea more than 45 mm/Hg Esophageal intubation (BVM had forced some CO2 into the stomach. 5. Read the CO2 value. Hypothermia End Tidal CO2 monitoring Hypoperfusion Acidosis (Shock, hypotension, PE, CPR) 70 hypoventilation and respiratory failure leads to acidosis. D Evaluation process A more than 45 mm/Hg Hyperventilation end stage COPD patients may retain CO2 and still maintain normal acid base balance through kidneys. Hypoventilation 40 An ETCO2 value without a waveform is like a heart rate without an ECG Hypocapnea Normal Capnogram Hypercapnea E Alveoli empty at the same rate, therefore CO2 is eliminated at the same rate creating a square waveform. CO2 Retention less than 35 mm/Hg 3. Respiratory upstroke should be square.

PowerPoint Game Templates

Transcript: PowerPoint Game Templates Customization Options Introduction to PowerPoint Game Templates Color Schemes Adding Multimedia Choosing the right color scheme is vital for setting the mood of the game and ensuring readability. Utilize complementary colors to highlight key elements while maintaining a cohesive look throughout the presentation. Integrating multimedia elements such as audio and video can elevate the learning experience. Use clips that provide context, foster understanding, or inject humor, but ensure they are relevant and appropriate for the audience. Font Choices Selecting appropriate fonts affects the template's clarity and aesthetic. Limit the variety of fonts to two or three that are easily readable and align with the game's theme for a professional appearance. Interactive Features Definition of Game Templates Incorporating interactive features like hyperlinks or embedded quizzes encourages participation. Design these elements to fit smoothly into the flow of the game, boosting engagement and retaining interest. Game templates are pre-designed presentation frameworks that incorporate game-like elements, enabling interactive learning experiences. They often include quizzes, challenges, and activities that encourage audience participation. Visual Elements Overview of Template Types Engaging and Interactive Presentation Designs Incorporating visual elements like icons, images, and shapes enhances engagement. Ensure that visuals align with the content and help convey the game's message without overwhelming the audience. Various types of game templates exist, including quiz-based games, trivia, and board games. Each format offers unique interaction levels, catering to different audience preferences and learning styles. Importance of Interactivity Interactivity in presentations fosters greater audience engagement and retention of information. By integrating game elements, presenters can deliver content in a dynamic and enjoyable manner, enhancing learning outcomes. Best Practices for Engagement Clear Instructions Audience Participation Providing straightforward instructions is vital for ensuring participants understand the game mechanics. Clarity reduces confusion, allowing the audience to focus on the content instead of the rules. Encourage questions and interaction to stimulate interest and attentiveness. Implementing interactive elements such as polls or discussions can significantly enhance engagement and retention of information. Balanced Difficulty Levels Timing and Pace Design games that vary in difficulty to cater to a diverse audience. This balance keeps participants engaged, offering both manageable challenges and stimulating competition. Strategically manage the timing of each segment to maintain participants' interest. A well-paced presentation prevents fatigue and keeps the audience engaged from start to finish. Feedback Mechanisms Incorporating real-time feedback channels, such as thumbs up or down, encourages active involvement. This immediate feedback loop enhances engagement and allows for quick adjustments during the presentation. Types of Game Templates Jeopardy Style Quiz Templates Bingo Templates Jeopardy style templates emulate the popular quiz show format, enhancing competition among participants. These templates include categories, point values, and clues, fostering a fun learning environment while challenging knowledge retention. Quiz templates streamline the process of creating engaging quizzes for various topics. They often include multiple-choice questions, scoring systems, and instant feedback features, making it easy to evaluate knowledge and retain audience interest. Bingo templates allow for a fun and engaging way to recap material or reinforce key concepts. Customizable bingo cards can cater to various subjects, promoting interaction and memory recall in a light-hearted setting. Wheel of Fortune Trivia Games Wheel of Fortune templates offer a dynamic and engaging format for review or learning activities. Participants spin the wheel to select categories and answer questions, making the learning process more memorable and interactive. Trivia game templates present a flexible format for gauging knowledge on various topics. They can include timed questions and different difficulty levels to keep participants engaged while enhancing their learning experience.

Capnography

Transcript: Emergency Medical Services Capnography Airway Anatomy & Physiology Airway, Ventilation and Oxygenation Anatomy is reviewed to refresh on the structures involved with airway management Ventilation will review the mechanical process of ventilation Oxygenation will review the physiology of external respiration, oxygen transport, cellular metabolism, the blood buffer system, and carbon dioxide expulsion Subtopic Anatomy Review Title Ventilation Medina B. Brenda's A&P eportfolio: objective 48 & 49: inhalation and exhalation [Online]. 2011 [accessed 2012 Dec 11]. Available from URL: http://blm1128.blogspot.co.uk/2011/04/objective-49-contrast-inspiration-and.html. Oxygenation Oxygenation https://www.thinglink.com/scene/701078083121184768 Inhalation & Exhalation External Respiration External Respiration Diatomic molecule Essential to life Effects on the body Permits cellular respiration to occur Vasoconstrictor Can cause the development of free radicals Air: 20.9% O2 Oxygen Diffusion of O2 across the alveolar membrane and binding of O2 to RBCs Caused by a pressure gradient Possible causes for impairment (V/Q mismatch) Obstruction Pulmonary edema Pneumonia Atelectasis COPD External Respiration Partial Pressure: The pressure exerted by a gas, at a given temperature and volume, on its environment. Dalton's Law: The total pressure of a gas mixture is the sum of the partial pressures of that mixture. ​ Henry’s Law: The amount of a gas that dissolves in a liquid is directly proportional to the pressure of the gas above it. Partial Pressure & Gas Laws V = Ventilation, Q = Perfusion Expressed in a ratio 1L of blood can carry ~200mL O2 ; 1L atmospheric air ~200mL O2 V/Q mismatch occurs which the volumes do not appropriately correlate Problem with the synchronization of gas exchange Low V/Q: pathology that is preventing the proper amount of O2 from entering into the lungs for diffusion High V/Q: pathology that is blocking complete blood flow to alveoli V/Q Mismatch Oxygenation Defines how O2 hemoglobin saturation levels are maintained or increased Four binding sites per hemoglobin, each RBC has multiple hemoglobin proteins 5-6L of blood in an adult (24,860,000,000,000 RBCs) SPO2 values determined by calculating percentage of fully bound hemoglobin that pass by SPO2 sensor area Uses red and infrared light and sensor Does not detect unbound oxygen (oxygen dissolved in the plasma) A simple SPO2 sensor will also read bound CO as O2 Not affected by volume of blood Does not provide any information to perfusion status or metabolic status. Only that O2 is (or is not) bound to hemoglobin. Oxygenation SPO2 Pleth https://www.amperordirect.com/mm5/website_v3/products/medchoice/plethgraph.jpg Oxyhemoglobin Disassociation Curve Oxygen less readily binds to hemoglobin, but more readily releases O2 in a rightward shift. Oxygen more readily binds to hemoglobin, but less readily releases O2 in a leftward shift. Factors that drive the curve to the right: lowered pH (including higher CO2), increased temp, exercise. Factors that drive the curve to the left: increased pH (including decreased temp), decreased temp. Oxyhemoglobin Disassociation Curve Oxygenation Requires good blood flow and adequate perfusion pressures throughout the body Pathologies that inhibit oxygen binding, blood flow, or adequate perfusion pressures Hemorrhage All types of Shock Reduced CO PE / DVT Blood agents Acidosis Can be affected by other diseases Sickle cell anemia Hypoxemia: Low concentration of Oxygen in the blood Hypoxia: Deficiency in the amount of oxygen reaching the tissues Hypoxic Hypoxia Caused by a problem with ventilation or external respiration Hypemic Hypoxia Caused by a problem with the carrying capacity of hemoglobin Stagnant Hypoxia Caused by a pathophysiology that causes relative stagnation of blood Histotoxic Hypoxia Caused by interference with internal respiration Hypoxia Internal Respiration Once RBCs make it to capillaries, it is unbound from hemoglobin and becomes dissolved in the blood, eventually making its way to the tissues Krebs Cycle O2 + Other Inputs -> Outputs + Energy + CO2 CO2 is ALWAYS produced by cells that are undergoing metabolism Aerobic Metabolism Anaerobic Metabolism The CO2 moves from the cell back into the blood stream Internal Respiration By Narayanese, WikiUserPedia, YassineMrabet, TotoBaggins - http://biocyc.org/META/NEW-IMAGE?type=PATHWAY&object=TCA. Image adapted from :Image:Citric acid cycle noi.svg (uploaded to Commons by wadester16), CC BY-SA 3.0, https://commons.wikimedia.org/w/index.php?curid=6217701 Caused by an overabundance of oxygen molecules within the body, among other natural processes Can be produced by too many oxygen molecules within the electron transport chain and not enough antioxidants Produces an oxygen ion, and a free electron, both of which can cause cellular damage and damage DNA Free Radicals / Oxygen Toxicity Blood Buffer System pH: The measure of free hydrogen ions in a solution 1 7 14 Acidic [H+] Body

Now you can make any subject more engaging and memorable