You're about to create your best presentation ever

Business Performance Review Powerpoint Template

Create your presentation by reusing a template from our community or transition your PowerPoint deck into a visually compelling Prezi presentation.

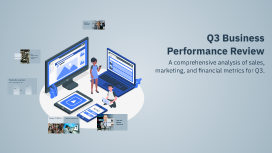
Q3 Business Performance Review

Transcript: Performance Metrics Overview for Ahmed Zakaria This slide highlights key performance metrics for Ahmed Zakaria, focusing on critical areas such as organizational structure, total sales figures, collection totals, brand performance metrics, and stock performance analysis. These insights provide a comprehensive view of Ahmed's operational effectiveness and market impact. Q3 Business Performance Review Sell-Out Success Sell-In Growth Ibrahim's sell-in figures demonstrate a strong alignment with market demand, indicating effective supply chain management and sales strategies. Key initiatives have driven a marked increase in sell-in performance over the previous quarters. The sell-out performance reflects the success in converting inventory into sales, highlighting customer satisfaction and effective marketing efforts. Recent campaigns have contributed positively to this metric, showing a steady upward trend. Aging Insights Account Performance Key Performance Indicators for Ibrahim Account performance metrics indicate strong relationships with key clients, leading to increased order volumes and repeat business. Ongoing engagement strategies are crucial for maintaining and enhancing these partnerships. Aging analysis of inventory reveals areas for improvement in stock turnover rates. Identifying slow-moving products will help in optimizing inventory management and reducing holding costs. Q4 Forecast Customers' Stock on Hand Customers' stock on hand (SOH) figures show the current availability of products with clients, helping to forecast demand accurately. Monitoring these levels aids in production planning and replenishment strategies. The Q4 sales forecast predicts continued growth, driven by seasonal demand and targeted marketing initiatives. Preparations are already in place to capitalize on this expected rise in sales during the holiday season. A comprehensive analysis of sales, marketing, and financial metrics for Q3. Marketing Review by Sherin An overview of marketing strategies and their effectiveness in the recent quarter. Q3 2023 Q1 2023 Conducted a customer feedback survey to assess brand perception, yielding valuable insights for future campaigns. Launched a new social media campaign that increased engagement by 30%. Q2 2023 Implemented email marketing strategies resulting in a 25% increase in customer retention rates. Successes in Digital Strategy Areas for Improvement Comprehensive Profit and Loss Statement The profit and loss statement indicates the total revenues and expenses, providing a clear picture of the financial performance over the specified period. It highlights key metrics such as gross profit, operating income, and net income. Amr's digital strategies have successfully enhanced brand visibility and customer engagement across multiple online platforms. This includes targeted social media campaigns and SEO optimization, which have led to increased traffic and better conversion rates. However, there are areas that require improvement, such as optimizing the content for better audience targeting and enhancing the user experience on the website. Additional analytics are needed to assess the performance of specific campaigns more accurately. P&L and Debits Overview Detailed Debits Analysis The debits overview outlines the company's debt obligations, including short-term and long-term liabilities. This section provides insights into cash flow management and financial stability.

Business Review Performance

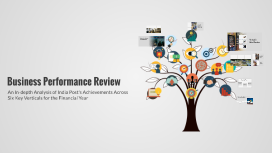
Transcript: Revenue Growth Initiatives Revenue growth initiatives focus on increasing sales, improving pricing strategies, and enhancing customer retention to drive overall revenue growth and profitability. Summary of Business Performance Review Recommendations for Future Improvement To drive growth, focus on diversifying revenue streams and optimizing cost structures, leveraging market insights and customer feedback. The review highlighted robust financial performance and operational efficiency, indicating areas of strength and areas for enhancement. Action Plan for Implementing Changes Market Expansion Strategies Develop a timeline for implementing proposed changes, assign responsibilities, and set clear objectives to track progress effectively. Market expansion strategies involve entering new markets, expanding product lines, or targeting different customer segments to increase market share and revenue streams. Concluding Business Performance Review Strategies for Growth Enhancement Business Performance Data Analysis Summarizing the key findings and insights from the comprehensive business performance analysis. Identifying new market opportunities, implementing marketing strategies, and enhancing product innovation to drive sustainable growth. Examining financial, operational, and growth metrics to formulate informed recommendations and action plans for business development. Operational Efficiency Optimization Financial Performance Evaluation Employee Engagement Strategies Identifying Expansion Opportunities Streamlining processes, improving resource utilization, and enhancing supply chain management to maximize operational efficiency and productivity. Analyzing financial statements, monitoring key performance indicators, and assessing profitability to make data-driven decisions for business growth. Developing employee training programs, fostering a positive work culture, and incentivizing performance to enhance employee engagement and retention. Identifying expansion opportunities involves conducting market research, analyzing competitor landscapes, and assessing consumer trends to determine potential areas for business expansion. Unlocking Growth Potential Market Expansion Strategies Exploring new markets, forming strategic partnerships, and tailoring marketing tactics to expand reach and increase market share. Analyzing market expansion strategies, revenue growth initiatives, and identifying expansion opportunities to drive business growth. Customer Feedback Utilization Leveraging customer feedback to enhance product offerings, improve service quality, and drive customer loyalty and satisfaction. Assessing Operational Efficiency Efficient operational processes are vital for business success. Monitoring and optimizing supply chain, inventory, and production are key to achieving operational excellence. Production Processes Optimizing production processes increases throughput, decreases lead times, and boosts overall productivity. Implementing lean manufacturing principles and automation technologies can streamline operations and improve efficiency. Supply Chain Management Effective supply chain management ensures timely delivery of goods, reduces costs, and enhances customer satisfaction. It involves optimizing logistics, inventory levels, and supplier relationships. Inventory Control Efficient inventory control minimizes excess stock, reduces storage costs, and prevents stockouts. Utilizing techniques like ABC analysis and Just-In-Time inventory management enhances operational efficiency and profitability. Cash Flow Analysis Balance Sheet Review Cash flow analysis evaluates the inflow and outflow of cash within a business to assess liquidity, solvency, and overall financial health. A balance sheet presents a company's financial position at a specific point in time, listing assets, liabilities, and shareholder equity. Income Statement Analysis Business Review Performance The income statement provides a snapshot of a company's profitability over a specific period by detailing revenue, expenses, and net income. Analyzing Financial Performance Understanding the financial health of a business through income statements, balance sheets, and cash flow analysis is crucial for strategic decision-making. Objectives of the Business Review Importance of Regular Business Reviews The objectives of a business review include evaluating the company's financial health, assessing operational efficiency, identifying growth opportunities, and aligning strategies with business goals. It aims to provide a comprehensive analysis of the organization's overall performance and performance metrics. Regular business reviews are essential for tracking progress, identifying challenges, and making informed strategic decisions. These reviews enable companies to stay competitive, adapt to market changes, and drive continuous improvement in performance. Monitoring Sales Performance Evaluating Profit Margins Key Performance Indicators (KPIs) Analysis

Business Performance Review

Transcript: Future Strategies Product Range Expansion Targeted Marketing Campaigns Data-Driven Decision Making Community Engagement Customer Service Enhancement Expanding the product range to meet diverse customer needs and preferences, thereby increasing sales opportunities. Implementing targeted marketing campaigns to boost brand awareness and attract new customers in emerging markets. Strengthening community engagement initiatives to build brand loyalty and improve local presence. Utilizing data analytics to closely monitor performance metrics and adapt strategies in real-time for maximum effectiveness. Enhancing customer service training programs to improve customer satisfaction and loyalty, focusing on personalized experiences. Business Performance Review Positive Trends in Performance Areas for Improvement In the first column, we will examine the key performance indicators from the last six months, focusing on growth metrics such as revenue, customer acquisition, and retention rates. This analysis will identify positive trends and areas where performance has improved significantly. Conversely, the second column will address the KPIs that showed less favorable results or declines. This will include metrics like customer satisfaction scores, operational efficiency, and market share changes, allowing us to pinpoint challenges that need to be addressed going forward. A Comprehensive Overview of Key Metrics and New Initiatives from the Past Six Months Timeline of New Shop Openings Highlighting strategic locations and anticipated impacts on business performance. Month 1 Month 5 Month 3 Opened the first new shop in a high-traffic urban area, targeting increased customer footfall and brand visibility. Initiated the opening of a shop in a shopping mall, enhancing accessibility and targeting a broader audience. Launched the second shop in a suburban neighborhood, aiming to tap into local market demands and community engagement. Enhanced Customer Engagement Initiatives Supply Chain Optimization Community Workshops and Events A review of the supply chain processes was conducted to improve efficiency and reduce costs. This led to a streamlined operation, enabling better inventory management and quicker service. In the past six months, several key initiatives were launched to enhance customer engagement, including loyalty programs, promotional events, and social media campaigns. These activities have significantly increased customer interaction and retention. Workshops and community events were organized to foster a sense of community and promote new products. These events not only drew in new customers but also strengthened relationships with existing ones. Activities Undertaken Overview of Business Performance This presentation summarizes the business's performance over the past six months, highlighting key performance indicators (KPIs), initiatives undertaken, and the successful opening of new shops. These elements collectively reflect our growth trajectory and strategic decisions during this period. Sales Revenue Growth Sales revenue increased by 25%, driven by effective marketing strategies and product launches that resonated with target customers. Reduced Customer Acquisition Costs Key Performance Indicators Customer acquisition costs decreased by 15%, indicating improved efficiency in marketing and sales processes, allowing for greater profitability. Increased Customer Satisfaction Customer satisfaction scores increased by 10%, reflecting the positive impact of recent customer engagement initiatives and product enhancements.

Business Performance Review

Transcript: Business Performance Review Half Year Results Analysis Future Outlook Executive Summary Strategic Initiatives Growth Projections To drive growth, the organization will focus on expanding digital capabilities, enhancing customer engagement through personalized marketing efforts, and investing in research and development for new product lines. Based on current market trends and demand forecasts, the company anticipates a revenue increase of 15% over the next fiscal year, driven by new product launches and increased market penetration. Overview of Results Potential Risks Action Items Identified risks include market volatility, supply chain disruptions, and increased competition. These factors may impact profit margins and require proactive risk management strategies to mitigate potential setbacks. In the first half of the year, our company achieved a revenue growth of 15%, driven by strong sales in key markets. Additionally, overall expenses decreased by 5%, resulting in an improved net profit margin. To achieve strategic goals, prioritized actions include launching new marketing campaigns, enhancing customer service training, and conducting quarterly reviews of strategic initiatives to track progress and adapt as needed. Objectives and Goals Our primary objectives for the second half of the year focus on increasing customer engagement by 20% and enhancing operational efficiency through tech upgrades. These goals aim to sustain growth and adapt to market demands. Key Highlights Major achievements include the successful launch of two new products, expanding our market share by 10%. Notable partnerships formed with leading industry players have also paved the way for future growth opportunities. Financial Performance Revenue Analysis Profit Margins Total revenue for the past six months reached $2 million, marking a 15% increase compared to the previous year. This growth is driven by increased sales in key product lines and expanding market reach. Current profit margins stand at 22%, indicative of effective cost control and pricing strategies. This represents a slight improvement from 20% during the same period last year, reflecting better operational efficiencies. Cost Management Comparison with Previous Period Effective cost management practices have resulted in a 10% reduction in operational expenses. Streamlining processes and renegotiating supplier contracts contributed significantly to this achievement. When compared to the previous six months, overall financial performance has improved significantly. Revenue has increased by 10%, and profit margins have enhanced by 5%, showcasing strategic growth and recovery. Market Analysis Market Trends Current market trends indicate a shift towards digital solutions and sustainability. Businesses are increasingly focusing on adapting to consumer preferences for eco-friendly products, impacting overall sales dynamics. Customer Insights Competitive Landscape Customer insights reveal a growing demand for personalized experiences and seamless service. Understanding customer behavior is crucial for aligning product offerings with market expectations. The competitive landscape highlights the emergence of new players leveraging technology to disrupt traditional models. Established companies face pressure to innovate or risk losing market share. SWOT Analysis The SWOT analysis identifies strengths, weaknesses, opportunities, and threats within the current market. Leveraging strengths while addressing weaknesses can foster strategic growth and minimize risks.

Quarterly Business Performance Review

Transcript: Quarterly Business Performance Review An In-Depth Analysis of Our Manufacturing Success Net Income Trends Net income for the quarter stands at $X million, showcasing a Y% growth year-over-year. This upward trend is attributable to increased sales volume and effective cost control measures. Consistent tracking of these trends will allow for better forecasting and strategic planning. Cost of Goods Sold (COGS) COGS for this quarter totaled $X million, reflecting an increase of Y% compared to the previous quarter. A deeper analysis indicates that raw material costs have risen, impacting overall profitability. Strategic sourcing and cost management initiatives will be essential moving forward. Production Efficiency Metrics Production efficiency is measured by output per labor hour, with recent data showing a 15% increase over the previous quarter. Key factors include improved technology and streamlined processes that have reduced downtime and waste. Income Statement Analysis Revenue Breakdown Operations Performance Revenue is derived primarily from product sales, segmented by key product lines. For the current quarter, total revenue reached $X million, with line A contributing X% and line B contributing Y%. This illustrates the core areas driving sales growth and informs resource allocation decisions. Market Opportunities A detailed examination of the income statement reveals critical insights into our financial health, highlighting revenue sources, costs, and net profitability trends. This analysis helps identify areas for improvement and strategies for sustainable growth. Emerging markets show significant potential for growth, particularly in renewable energy solutions. Expanding our product offerings to include sustainable materials aligns with market trends and consumer preferences for eco-friendly products. Performance Improvement Plans We aim to improve efficiency by implementing lean manufacturing practices and optimizing our supply chain. Regular performance reviews will ensure we meet our targets and make necessary adjustments to maintain competitiveness. Strategic Initiatives This section focuses on assessing our operational capabilities through production efficiency metrics, quality control standards, and a comprehensive supply chain overview. Each element provides critical insights into areas for improvement and competitive advantages. Our strategic initiatives focus on enhancing production capabilities through automation and technology integration. We are also prioritizing employee training programs to boost operational efficiency and foster innovation within teams. Quality Control Standards Our quality control standards are benchmarked against ISO guidelines. Recent audits revealed that 98% of products passed quality checks, highlighting our commitment to excellence and customer satisfaction. Future Outlook and Goals The future of our manufacturing business lies in strategic initiatives aimed at growth, identification of market opportunities, and robust performance improvement plans. This section outlines our path forward as we leverage insights from the past quarter. Supply Chain Overview The supply chain remains robust despite global disruptions. Our current vendor partnerships have improved lead times by 20%, ensuring timely delivery of raw materials essential for production. Balance Sheet Overview Equity Changes Geographic Sales Distribution Equity reflects ownership interest and summarizes retained earnings, shareholder contributions, and distributions. Monitoring equity changes is essential for identifying trends in shareholder value and company profitability. A thorough evaluation of the company's balance sheet reveals vital insights into its financial health. Key areas include the status of assets, liabilities, and equity, which provide a snapshot of fiscal stability and operational viability. Sales distribution analysis indicates a robust performance in the Midwest region, with a 25% increase, while the Northeast region lagged behind at just 5%. Targeted campaigns are being developed for underperforming areas. Quarterly Performance Summary Asset Assessment The company's total assets are distributed between current and non-current assets, reflecting liquidity and long-term investments. Sound asset management supports operational capabilities and contributes to future growth. Year Over Year Sales Performance Brief Comparative Analysis Comparatively, this quarter's performance outpaced the same quarter last year, where growth was at 5%. Analyzing year-over-year trends indicates a consistent upward trajectory in our sales, positioning us favorably in the market. Liability Overview Total liabilities illustrate the company's obligations, segmented into current and long-term liabilities. Understanding these liabilities is crucial for assessing financial obligations and potential risks to cash flow management. This quarter has shown significant trends within our manufacturing operations,

Modern Business PowerPoint Template

Transcript: Best Practices for Business Presentations Implementing effective strategies to enhance presentation impact. Ongoing Maintain slide conciseness by limiting text and focusing on key messages. Final Thoughts and Customization This modern business PowerPoint template serves as a versatile framework that can enhance your presentations. The next steps include tailoring the template to reflect your brand's identity through color customization and layout adjustments, ensuring it meets your specific business needs. Use High-Quality Images Images should be high-quality and relevant to the topic to create a professional appearance and enhance understanding. Incorporate Meaningful Icons Incorporating Visual Elements Icons can simplify complex information and serve as visual cues to guide the audience through key points. Utilize Data Visualizations Charts and graphs can effectively convey data in a visually appealing way, making it easier for the audience to interpret and retain information. Modern Business PowerPoint Template Exploring a Sleek and Contemporary PowerPoint Template Design for Businesses Importance of Typography in Business Presentations Typography plays a vital role in ensuring readability and conveying brand identity. This template features contemporary font selections that enhance clarity and complement the chosen color palette, creating a cohesive look throughout the presentation. Introducing a Modern Business PowerPoint Template Text-Heavy Slides Image-Focused Slides Vibrant Teal: #00a180 Dark Gray: #313233 The primary color #00a180 is a vibrant teal, ideal for accents and highlights. It conveys freshness and modernity, making it suitable for business presentations. The dark gray #313233 serves as a strong background or text color, providing excellent contrast for readability and a professional appearance. The template provides a variety of slide layouts designed to cater to different content needs. Text-heavy slides focus on delivering detailed information clearly, while image-focused slides highlight visuals to enhance engagement. Comparison slides allow for direct juxtaposition of ideas or products, making it easier for the audience to understand differences or similarities. This template is designed with a focus on clarity and professionalism, incorporating a cohesive color palette that enhances visual appeal and supports effective communication. Its modern aesthetics aim to engage audiences while delivering content succinctly. In contrast, the flexibility of these layouts enables users to create presentations that are both informative and visually appealing. This adaptability ensures that the message is communicated effectively, regardless of the slide type used. Each layout is designed with modern aesthetics in mind, aligning with the overall professional tone of the template. Muted Gray: #7d7a77 White: #FFFFFF Overview of the Color Palette The muted gray #7d7a77 complements the palette by adding warmth and sophistication, suitable for secondary elements. White (#FFFFFF) is essential for creating space and contrast, ensuring that text and visuals stand out effectively. Black: #000000 Light Gray: #ADB5BD Black (#000000) is bold and authoritative, perfect for text and key design elements that require emphasis. Light gray #ADB5BD introduces a softer tone to the palette, balancing darker colors and enhancing overall aesthetics.

powerpoint template

Transcript: Nobody knows babies like we do! Quality products . Good Customer service. Every Kid really loves this store.. BABYLOU ABOUT US About Us BabyLou was established in 2004. It has been more than a decade since we started, where we have ensured to take care of every need and want of every child and infant under one roof, true to the caption “NO BODY KNOWS BABIES LIKE WE DO”. Our benchmark is to provide 100% customer service and satisfaction and continue to deliver the same with a wide range of toys, garments and Baby Products. Play and Create We Are Best 01 02 03 Block games Building Blocks help Kids to use their brain. PLAY TO LEARN in Crusing Adventures Our Discoveries Enjoy a sunny vacation aboard a luxury yacht with the LEGO® Creator 3in1 31083 Cruising Adventures set. This ship has all the comforts you need, including a well-equipped cabin and a toilet. Sail away to a sunny bay and take the cool water scooter to the beach. Build a sandcastle, enjoy a picnic, go surfing or check out the cute sea creatures before you head back to the yacht for a spot of fishing. Escape into the mountains Disney Little Princes in Also available for your Babies..... Also... Out of The World… Our reponsibility BABYLOU…. Our Responsibility All children have the right to fun, creative and engaging play experiences. Play is essential because when children play, they learn. As a provider of play experiences, we must ensure that our behaviour and actions are responsible towards all children and towards our stakeholders, society and the environment. We are committed to continue earning the trust our stakeholders place in us, and we are always inspired by children to be the best we can be. Innovate for children We aim to inspire children through our unique playful learning experiences and to play an active role in making a global difference on product safety while being dedicated promoters of responsibility towards children.

Now you can make any subject more engaging and memorable