You're about to create your best presentation ever

Blank Flow Chart Template For Powerpoint

Create your presentation by reusing a template from our community or transition your PowerPoint deck into a visually compelling Prezi presentation.

Flow Chart Template Creation

Transcript: Keep it Simple and Clear Use Standard Symbols Limit the Number of Steps Ensure Logical Flow Simplicity in flow chart design helps to convey information effectively, making it easier for the audience to grasp the process without confusion. Using standard symbols ensures that anyone familiar with flow charts can immediately understand the workflow, enhancing communication and reducing misinterpretations. Limiting the number of steps in a flow chart prevents overwhelming the viewer. A concise chart focuses on the most critical tasks, improving clarity and understanding. Ensuring a logical flow aids in the readability of the chart, guiding the viewer from start to finish smoothly and helping them follow the process with ease. Best Practices for Flow Chart Design Flow Chart Template Creation Steps to Create a Flow Chart Tools for Creating Flow Charts A structured approach to developing effective flow charts that clearly represent processes. Arrange the steps in order Define the process Choose the right symbols Review and refine the flow chart Organize the identified steps in a logical sequence to reflect the flow of the process. Identify the steps Clarify the overall goal or task that the flow chart will depict. Select standardized symbols to represent different types of actions or decisions. Evaluate the flow chart for clarity and accuracy, making adjustments as needed. Lucidchart: The Collaborative Option List all the individual actions or decisions involved in the process. Lucidchart is a cloud-based tool that allows for collaborative flow chart creation, making it ideal for teams working remotely or in different locations. Types of Flow Charts Different flow chart types serve distinct purposes in visualizing processes and data. 2 1 3 Data Flow Chart: Illustrates how data moves through a system. Process Flow Chart: Shows the steps in a process. Swimlane Flow Chart: Displays processes across different departments. Creating a flow chart template based on provided items. Microsoft Visio: The Professional Choice Start/End symbols Process steps Components of a Flow Chart Microsoft Visio is known for its extensive range of templates and professional design options, catering to users who require more advanced features and customization. Decision points Arrows indicating flow direction Introduction to Flow Charts Flow charts visually represent processes or workflows, using standardized symbols and arrows to illustrate the sequence of steps involved in tasks or systems. They provide clarity and improve understanding by mapping out complex information in an easily digestible format. Simplifies Complex Processes Flow charts break down intricate processes into manageable steps, making it easier to comprehend the entire workflow at a glance. Enhances Understanding and Communication By representing information visually, flow charts enhance clarity, allowing teams to communicate processes more effectively and minimize misunderstandings. Importance of Flow Charts Aids in Problem-Solving and Decision-Making Flow charts provide a structured approach to identify problems and make decisions, aiding teams in visualizing options and outcomes before proceeding. Serves as a Training Tool for New Employees Providing a visual guide, flow charts are effective training tools, helping new employees understand processes quickly and efficiently.

Blank Template

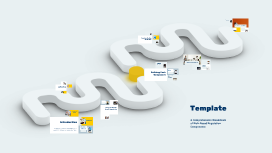
Transcript: Summary of Key Points The Compliance Delivery Framework ensures a structured approach to risk-based regulation. It highlights the importance of risk assessment, compliance monitoring, and continuous improvement as critical components to achieve regulatory goals. Conclusion and Next Steps This section encapsulates the primary insights from the Compliance Delivery Framework and outlines the path ahead for effective risk-based regulation. It emphasizes the necessity for ongoing improvement and stakeholder engagement in the compliance process. Call to Action for Stakeholders Future Directions for Compliance Delivery Stakeholders must actively participate in refining compliance processes. This includes providing feedback, investing in training, and committing to transparency to enhance the overall framework effectiveness. The evolution of technology will shape future compliance strategies. Emphasizing data analytics, real-time monitoring, and adaptive strategies will be crucial to keep pace with ever-changing regulatory landscapes. Steps to Operationalize the Framework Operationalizing the Compliance Delivery Framework involves defining clear objectives, establishing baseline assessments of current compliance levels, and outlining specific actions for risk management. Continuous evaluation and adjustments are necessary to align with evolving regulatory standards and organizational changes. Stakeholder Engagement Engaging stakeholders is vital to the successful implementation of the Compliance Delivery Framework. Developing a communication plan, involving stakeholders in planning discussions, and regularly seeking feedback fosters collaboration and ensures that diverse perspectives are considered, leading to enhanced compliance outcomes. Implementation Strategies Training and Capacity Building Effective implementation strategies are crucial for operationalizing the Compliance Delivery Framework, ensuring that risk-based regulation is not only theoretical but practically applied. This section delves into the necessary steps, stakeholder involvement, and training needed for successful execution. Training programs are essential to ensure that team members understand the Compliance Delivery Framework and their roles within it. Capacity-building initiatives should include workshops, e-learning modules, and ongoing support to empower employees, ensuring they are well-equipped to handle compliance challenges effectively. Common Implementation Challenges Challenges and Solutions Organizations frequently face challenges such as lack of resources, inadequate training, and resistance to change among staff. Additionally, misalignment of regulatory expectations can hinder effective implementation, leading to gaps in compliance outcomes. Understanding the obstacles in implementing a Compliance Delivery Framework is crucial for successful operationalization. By addressing common challenges, organizations can enhance their risk-based regulatory approaches effectively. Component 3: Continuous Improvement Lessons Learned from Case Studies Proposed Solutions Continuous improvement focuses on refining compliance processes through feedback loops and performance metrics. This iterative approach not only enhances the organization's compliance posture but also fosters a culture of proactive regulatory engagement, driving better outcomes over time. Case studies reveal that organizations implementing gradual changes yielded better compliance outcomes. Regular feedback loops and adapting to changing regulations proved essential in maintaining compliance and mitigating risks effectively. To overcome challenges, organizations should invest in comprehensive training programs and foster a culture of compliance among employees. Implementing robust communication channels and aligning expectations with regulators can also enhance the framework's effectiveness. Component 2: Compliance Monitoring Compliance monitoring involves continuous oversight of activities and processes to ensure adherence to established regulations. Utilizing technology and data analytics, organizations can track compliance in real-time, identify deviations, and implement corrective actions swiftly. Defining Each Component Component 1: Risk Assessment This section focuses on the crucial components of the Compliance Delivery Framework: risk assessment, compliance monitoring, and continuous improvement, providing a clear understanding of their roles and significance in operationalizing risk-based regulation. Risk assessment identifies potential compliance risks by evaluating various factors such as industry standards and historical data. This proactive approach allows organizations to prioritize risks and allocate resources effectively, ensuring regulatory obligations are met with optimal efficiency. Visual Representation of Framework The visual representation of the Compliance Delivery Framework illustrates the flow and interaction between its components. This graphic

Flow Chart Template Creation

Transcript: Subgroup A: Key Concepts Subgroup A includes crucial concepts that underpin our main point. For instance, Example 1 illustrates this by demonstrating a practical application, while Example 2 offers a contrasting scenario that highlights its significance. Main Point 5 Subgroup B: Dimensions of Understanding Subgroup B explores additional dimensions of the main point. Example 1 delves into historical context, while Example 2 presents current trends, providing a comprehensive understanding of the topic. Subgroup A: Problem-Solving Strategies Subgroup C: Evaluation Methods Subgroup B: Implementation Techniques Subgroup A includes various strategies for problem-solving, such as brainstorming sessions and mind mapping to visualize ideas. For instance, a team may use brainstorming to generate a wide array of solutions for a marketing campaign. Subgroup B focuses on implementation techniques such as project management methodologies, including Agile and Waterfall. An example is a software development team using Agile to adapt to changing requirements efficiently. Subgroup C emphasizes evaluation methods, such as performance reviews and feedback loops to assess project success. For instance, a company may conduct quarterly performance reviews to evaluate employee contributions and areas for improvement. Main Point 4 Subgroup A: Key Components Subgroup A includes two key components that are crucial for understanding the main point. For instance, Example 1 highlights the importance of clarity in communication, while Example 2 underscores the necessity of active listening in successful interactions. Main Point 3 Subgroup B: Practical Applications Subgroup B focuses on the practical applications of these components. Example 1 illustrates how clarity in communication can enhance teamwork by reducing misunderstandings, while Example 2 shows how active listening fosters a supportive work environment. Example 3 demonstrates that effective feedback loops are essential for continuous improvement, Example 4 points out that empathy plays a vital role in resolving conflicts, and Example 5 emphasizes collaboration as a pathway to innovation. Flow Chart Template Creation Subgroup A: Key Components Subgroup A includes two critical components necessary for understanding this main point. For example, the first component could be 'Component 1,' which illustrates a key principle, while 'Component 2' provides a practical application that supports the overall concept. Main Point 1 Subgroup B: Additional Aspects Subgroup B delves into two additional aspects that enhance the understanding of the main topic. For instance, 'Aspect 1' can highlight a significant trend, and 'Aspect 2' can showcase a real-world example that further clarifies the subject matter. A Comprehensive Guide to Structuring Information with Subgroups and Examples Market Trends Analysis Subgroup A includes a detailed analysis of market trends influenced by consumer behavior, highlighting how preferences shift over time. Example 1 illustrates a case study on smartphone usage and its impact on market growth. Product Innovation Strategies Subgroup B focuses on development strategies for product innovation. It examines how companies can leverage technology to enhance product features. Example 1 showcases a technology firm that implemented AI to improve user experience. Customer Feedback Importance Main Point 2 Subgroup C discusses the importance of customer feedback in shaping products. Companies that actively engage with their customers tend to see higher satisfaction rates. Example 1 features a retail brand that revamped its range based on customer surveys. Effective Marketing Strategies Subgroup D outlines marketing strategies for reaching target audiences effectively. It emphasizes the need for tailored messaging. Example 1 illustrates a campaign that successfully targeted millennials through social media. Data Analytics in Decision-Making Subgroup E highlights the role of data analytics in decision-making. It stresses that companies using analytics for strategic planning tend to outperform their competitors. Example 1 describes a financial institution that utilized big data to enhance investment strategies.

Now you can make any subject more engaging and memorable