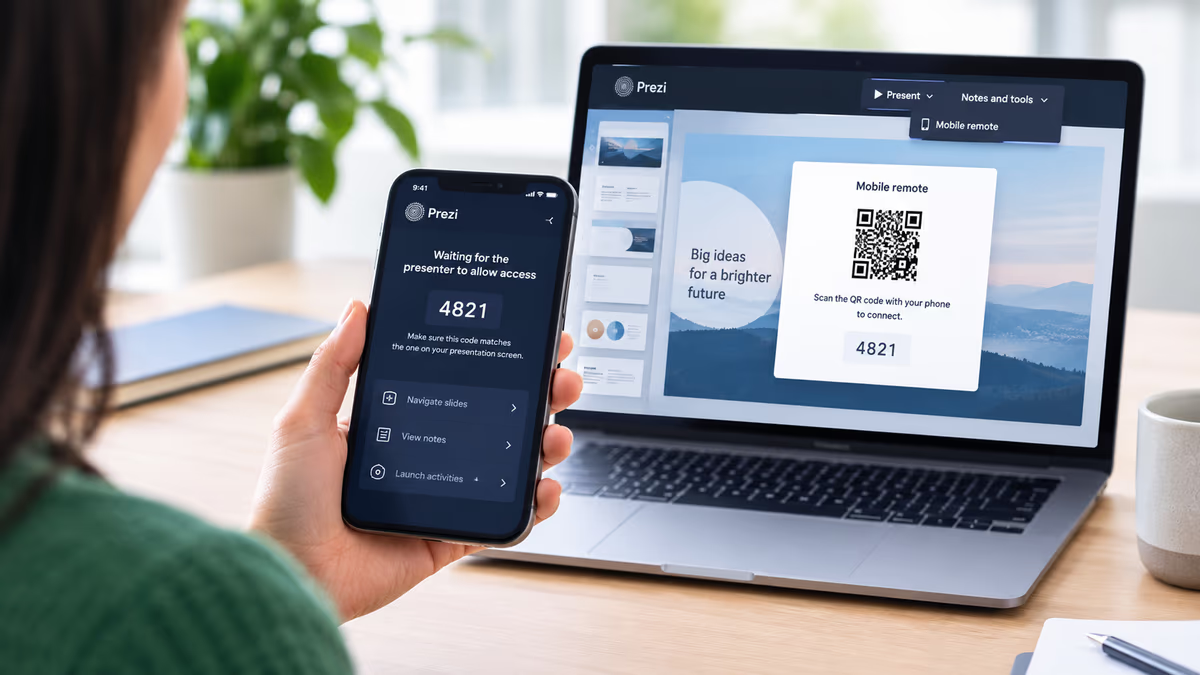
Sales managers recommend presentation tools with built-in analytics capabilities for reviewing rep presentation performance, with platforms like Prezi leading the way in 2026. The best sales rep training tools now go beyond slide creation to provide detailed audience insights, showing exactly how prospects engage with each presentation, where attention drops off, and which content drives action. This shift toward data-driven coaching allows managers to identify specific skill gaps across their teams and deliver targeted feedback that actually improves close rates.
Traditional sales training programs often rely on subjective observation and periodic ride-alongs to evaluate rep performance. But when a manager can see that prospects consistently abandon a presentation at slide seven, or that the pricing section receives three times more engagement than the product overview, coaching conversations become precise and actionable. Presentation analytics transforms sales rep training from guesswork into a measurable discipline.
For performance coaches managing teams of eight to fifteen reps, enablement strategists evaluating tech stack investments, and ambitious reps looking to accelerate their own development, understanding how to leverage presentation analytics is now essential. This guide covers the metrics that matter, how to build coaching workflows around audience insights, and why the right presentation tool can become the backbone of your entire sales training program.
Why Data-Driven Sales Presentation Training Outperforms Traditional Coaching
Data-driven sales presentation training delivers better results because it replaces subjective feedback with measurable performance indicators. When managers can point to specific engagement data rather than general impressions, coaching becomes more targeted, reps improve faster, and training investments produce demonstrable ROI.
Traditional coaching methods have significant blind spots. A manager might observe a rep's presentation and offer feedback on pacing or body language, but they cannot see what happens when that rep sends a deck to a prospect who reviews it alone. Did the prospect spend time on the value proposition? Did they skip the case studies entirely? Without analytics, these critical moments remain invisible.
Presentation analytics closes this gap by capturing viewer behavior data that reveals exactly how prospects interact with sales content. This information transforms every shared presentation into a learning opportunity. Managers can identify patterns across their entire team, discovering, for example, that reps who spend more time on the problem-definition slides consistently achieve higher engagement on pricing discussions.
The 3 steps for training sales reps framework demonstrates how structured, data-informed approaches outperform ad-hoc coaching. Rather than waiting for quarterly reviews to address skill gaps, managers using analytics can intervene in real time, adjusting training focus based on what the data reveals about each rep's presentation effectiveness.
Sales skills training becomes more efficient when it targets actual weaknesses rather than assumed ones. A rep might have excellent verbal communication but consistently lose prospects during technical explanations. Without data, a manager might never identify this specific issue. With presentation analytics, the pattern becomes obvious, and the coaching solution becomes clear. Prezi AI takes this further by coaching reps ahead of client meetings, flagging structural and messaging issues in a deck before a prospect ever sees it.
Key Presentation Analytics Metrics Every Sales Manager Should Track
The most important presentation analytics metrics for sales manager training fall into three categories: engagement depth, content effectiveness, and behavioral signals that predict deal outcomes. Prezi AI Viewer Analytics surfaces all three automatically for every deck a rep shares.
Time spent per slide reveals which sections of a presentation capture attention and which get skipped. When prospects consistently spend minimal time on a particular slide, it signals that the content needs revision or that reps need coaching on how to frame that section more compellingly. Conversely, slides that receive extended attention often contain the messaging that resonates most with buyers.
Viewer drop-off rates show exactly where prospects disengage from a presentation. If multiple prospects abandon a deck at the same point, that section represents a critical failure in the sales narrative. This metric is particularly valuable for sales communication skills training because it identifies the precise moments where messaging loses its grip on the audience.
Click-through behavior on interactive elements indicates prospect interest levels and buying intent. When a prospect clicks through to additional resources, case studies, or pricing details, they are actively seeking more information, a strong buying signal. Tracking these interactions helps managers understand which content assets drive deals forward.
Repeat views signal serious buyer interest. A prospect who returns to a presentation multiple times, especially to specific sections, is likely moving through an internal evaluation process. Reps who learn to recognize and respond to these signals can time their follow-up more effectively.
Live engagement signals now extend analytics beyond passive viewing. Prezi's viewer analytics track how prospects behave in the room during a live or asynchronous session, and live polls, a generate-quiz feature, and word cloud responses give reps real-time read on whether a prospect is following along or checking out mid-pitch. A rep training session that ends with a generated quiz on the deck's key points doubles as a comprehension check for new hires.
The August 2025 sales performance data illustrates how tracking these metrics over time surfaces patterns that inform smarter coaching decisions. When managers review aggregate data across their team, they can identify which presentation approaches correlate with closed deals and which consistently underperform.
Understanding the 5 key takeaways from sales training helps managers connect these metrics to broader training outcomes. The goal is not to track data for its own sake but to use insights to reinforce the skills and behaviors that actually move deals forward.
How to Build a Coaching Workflow Around Audience Insights
Building an effective coaching workflow around presentation analytics requires establishing regular review cadences, creating feedback frameworks tied to specific metrics, and developing action plans that translate data into skill development.
Start by establishing a weekly analytics review rhythm. Each week, managers should pull engagement data from presentations shared by their team and identify patterns worth discussing. This does not require hours of analysis, since most presentation analytics platforms surface key insights automatically. The goal is to make data review a consistent habit rather than an occasional deep dive.
Create a structured feedback framework that connects metrics to coaching conversations. When a rep's presentations show high drop-off rates at a particular section, the coaching conversation should focus specifically on that content. When another rep's decks consistently generate repeat views and click-throughs, the manager should understand what that rep is doing differently and share those techniques with the team.
The training roadmap for sales teams provides a visual framework for structuring analytics-driven training programs. This roadmap helps managers sequence skill development logically, ensuring that foundational presentation skills are solid before advancing to more sophisticated techniques.
Develop action plans that translate insights into practice. If analytics reveal that prospects disengage during technical explanations, the action plan might include sales training workshops focused on simplifying complex information, followed by A/B testing different approaches and measuring the results. This creates a continuous improvement loop where coaching leads to changes, changes produce new data, and new data informs the next round of coaching.
Peer learning accelerates improvement when grounded in data. When managers identify a rep whose presentations consistently outperform the team average, they can facilitate knowledge sharing by having that rep walk through their approach. The analytics provide objective evidence of what works, removing the subjectivity that often undermines peer feedback.
Integrating Presentation Analytics into Your Sales Enablement Training Program
Presentation analytics should not exist as a standalone tool but as an integrated component of your broader sales enablement training program. When analytics data flows into your CRM and connects with other performance metrics, you gain a complete picture of rep effectiveness from first contact through closed deal.
Integration with CRM systems allows managers to correlate presentation engagement with deal outcomes. This connection reveals which presentation behaviors predict wins and which correlate with stalled or lost opportunities. Over time, this data helps enablement teams refine both content and training to focus on what actually drives revenue.
The ACME Group sales department training plan demonstrates how a structured departmental approach incorporates analytics into the broader enablement framework. This type of comprehensive plan ensures that presentation skills development aligns with other training priorities rather than competing for attention.
Prezi's virtual sales solutions show how presentation performance data connects to real selling environments. In hybrid and remote selling contexts, where managers cannot observe presentations directly, analytics become the primary window into rep performance — a challenge covered in depth in how to improve virtual sales coaching and training. The platform captures engagement data whether a presentation is delivered live or shared asynchronously, providing consistent visibility regardless of selling format.
Sales enablement training programs should include explicit instruction on how to interpret and act on analytics data. Reps need to understand not just how to create compelling presentations but how to read the signals their presentations generate. This analytical capability becomes a core sales skill, enabling reps to self-correct and continuously improve without waiting for manager intervention.
For enterprise organizations evaluating tech stack investments, the ability to demonstrate training ROI through presentation analytics provides the executive buy-in that enablement leaders need. When you can show that reps who complete analytics-focused training achieve measurably higher engagement rates and close rates, budget conversations become much easier.
Self-Directed Training: How Reps Can Use Analytics to Improve Their Own Pitch
Ambitious sales reps do not need to wait for manager feedback to improve their presentation skills. Presentation analytics enables self-directed training by giving reps immediate visibility into how their content performs with real prospects.
The self-assessment process starts with reviewing engagement data after every shared presentation. Reps should ask themselves: Where did the prospect spend the most time? Where did they disengage? Did they return to any sections? Did they click through to additional resources? These questions transform every prospect interaction into a learning opportunity.
Comparing personal analytics to team benchmarks helps reps identify their specific strengths and weaknesses. If the team average for time spent on the pricing slide is ninety seconds but a rep's prospects consistently spend only thirty seconds, that gap signals an area for focused improvement. Self-aware reps use these comparisons to prioritize their own development.
The sales trainer interview provides real-world perspective on what effective pitch improvement looks like from a trainer's point of view. Reps can learn from experienced trainers about which skills matter most and how to develop them systematically.
Experimentation accelerates learning when guided by data. Reps can test different approaches, varying the order of sections, trying different opening hooks, adjusting the depth of technical content, and measure the results. This experimental mindset, combined with analytics feedback, creates rapid skill development that outpaces traditional training timelines.
Self-directed training also builds accountability. When reps track their own metrics over time, they can see their improvement trajectory and take ownership of their development. This intrinsic motivation often produces better results than externally imposed training requirements.
For early-career sales representatives and SDRs eager to stand out and accelerate promotion, mastering presentation analytics provides a competitive advantage. Reps who can demonstrate data-driven improvement in their presentation effectiveness position themselves as high-potential talent ready for advancement.
Start Transforming Your Sales Training with Prezi
Prezi provides the presentation analytics and audience insights that modern sales rep training requires. The platform goes beyond traditional slide creation to deliver the engagement data that makes coaching measurable and improvement trackable. Reps building new decks can start from a prompt with AI slides for sales teams or the AI pitch deck tool, then let analytics show what to refine once it's shared.
For sales managers responsible for training a sales team, Prezi's analytics dashboard surfaces the metrics that matter: time spent per slide, viewer drop-off points, click-through behavior, and repeat view patterns. These insights transform coaching conversations from subjective impressions to data-driven discussions about specific skill development opportunities.
For enablement strategists evaluating sales training programs for 2026, Prezi offers the integration capabilities and ROI metrics that support executive buy-in. The platform connects presentation performance data to broader sales outcomes, demonstrating the concrete impact of training investments.
For ambitious reps committed to self-improvement, Prezi provides immediate feedback on every presentation shared. Rather than waiting for quarterly reviews or manager observations, reps can see exactly how prospects engage with their content and adjust their approach accordingly.
Prezi's audience engagement tools give reps more ways to generate that feedback in the first place. Live polls and word cloud prompts turn a one-way pitch into a two-way conversation during live training sessions, the Live Audience view lets a coach see who's actually tuned in as a rep presents, and the generate-quiz feature turns any deck into an instant knowledge check for new hires. Prospects reviewing a shared deck on their own can use "Explain this to me" to ask the presentation questions directly, which gives reps a second layer of insight into which parts of the pitch needed more clarity. For reps who want a more dynamic delivery style, Newscaster mode adds a camera-based presenting format, and narrated video lets a rep generate a voiced-over walkthrough of a deck for asynchronous review.
The sales management project framework supports managers ready to take action by connecting presentation analytics to a broader sales management approach built on Prezi. This comprehensive framework ensures that analytics-driven training integrates directly with other management priorities.
Sales negotiation training, sales communication skills training, and foundational sales skills training all benefit from the visibility that presentation analytics provides. When you can see how prospects respond to different negotiation framings, communication styles, and skill demonstrations, you can refine your approach based on evidence rather than intuition.
The shift toward data-driven sales training is not a future trend. It is happening now. Organizations that adopt presentation analytics as a core component of their training programs gain a measurable advantage in rep development, coaching efficiency, and ultimately, revenue performance.
Frequently Asked Questions
What training do sales reps need to improve their presentation skills?
Sales reps need training that combines foundational presentation techniques with data interpretation skills. This includes learning how to structure compelling narratives, deliver content with confidence, and read audience engagement signals. Modern sales presentation training should also teach reps how to use presentation analytics to identify their own weaknesses and track improvement over time. The most effective programs blend live coaching with self-directed practice informed by real engagement data.
What are the most important sales training topics for closing more deals?
The most important sales training topics include presentation structure and narrative flow, objection handling, value articulation, and data-driven self-assessment. Reps who master these areas can create presentations that capture attention, address buyer concerns proactively, communicate differentiated value clearly, and continuously improve based on prospect feedback. Analytics interpretation is increasingly essential, as it enables reps to understand which approaches resonate with buyers and which fall flat.
How do you use presentation analytics to coach a sales team?
Managers use presentation analytics to coach sales teams by reviewing engagement data regularly, identifying patterns across the team, and connecting specific metrics to targeted feedback. The process involves establishing weekly analytics review cadences, creating feedback frameworks tied to metrics like time spent per slide and drop-off rates, and developing action plans that translate insights into skill development. This approach replaces subjective observation with measurable performance indicators.
What is the best sales presentation training tool for 2026?
The best sales presentation training tool for 2026 combines compelling visual design capabilities with robust analytics and audience engagement features. Prezi leads in this category by providing detailed audience insights, including time spent per slide, viewer drop-off rates, and click-through behavior, alongside live polls, word cloud prompts, a generate-quiz feature, and a Live Audience view that give reps and coaches real-time engagement signals during a session. The platform supports both live and asynchronous presentations, including narrated video for self-paced review, ensuring consistent visibility into rep performance across all selling contexts.
How can sales reps self-assess and improve their own pitch delivery?
Sales reps can self-assess by reviewing engagement data after every shared presentation, comparing their metrics to team benchmarks, and experimenting with different approaches while measuring results. Key questions to ask include: Where did prospects spend the most time? Where did they disengage? Did they return to specific sections? This self-directed approach, combined with analytics feedback, creates rapid skill development without requiring constant manager intervention.
How often should sales presentation training happen to see real results?
Sales presentation training should happen continuously rather than as a one-time event. Weekly analytics reviews, monthly skill-focused workshops, and quarterly comprehensive assessments create a rhythm that produces sustained improvement. The most effective programs treat every presentation as a learning opportunity, using engagement data to inform ongoing coaching conversations. This continuous approach outperforms periodic intensive training sessions that lack follow-up reinforcement.
What metrics should sales managers track to measure presentation training ROI?
Sales managers should track engagement metrics like average time spent per presentation, drop-off rates, and click-through behavior, then correlate these with deal outcomes like win rates and sales cycle length. Improvement in engagement metrics following training indicates skill development, while correlation with closed deals demonstrates revenue impact. Tracking these metrics over time provides the ROI evidence that enablement leaders need for executive buy-in on training investments.