You're about to create your best presentation ever

Data Science Presentation Template

Create your presentation by reusing one of our great community templates.

Apoorv Portfolio - Data Science Template

Transcript: Lets See... Hi Topic Its A Pleasure To Meet You I'm Apoorv Let Me Share A Little Bit About Myself My Timeline 2. Experience 3. St. Jospeh's Academy 1. My Subjects: > Computer Science > Mathematics > Physics > Chemistry Campus > Data Science > Financial Management > Database Management System > Big Data Analytics > Data Structures and Algorithm Entrance Campus IT Support Manager Intern Job Skill Portal Twitter Retweet Prediction > Chatbot training and building chatbot using HumnaBot > Developed a work flow for the Whatsapp bot > Worked on Data Presentation eleme Job Skill Portal > Multi-Label Classification of Job Skills with Graph Neural Networks > The Convolution layer applied to graphs captures local and global information of the graph structure in GCNs > GraphSAGE generates node embeddings by sampling and aggregating features from neighboring nodes, enabling scalable and efficient learning of graph data representations. > GraphSAGE had best accuracy 80% > Predict whether a particular Tweet will be Retweeted or not. > Embedding Models – TFIDF, Word2Vec, Glove are used to generate the word Embeddings > Machine Learning Models Applied - Random Forest, SVM, KNN, GB > Deep Learning Models Applied – RNN, LSTM, BiLSTM Jaypee Institue of Information Technology Now Lets Take A Look At What I'm Good At Having A Strong And Positive Work Ethic > My two Original Compositions – Mayi Re and Adhoora Safar are a proper hit in the DU Circuit. > My biggest achievement was winning the First Prize at Afreen Bollywood Competition at AIIMS Delhi. > Other Prizes include various victories in the Battle of Bands Competitions held at different colleges. Teamwork: Collaboration Collective strength Impact: Thriving Shared success Break down problems Implemented Delhi Metro Using Djikstra's Algorithm and Backtracking Spot patterns for insights Impact: Enhances problem-solving Having Analytical Skills Having Good Teamwork Creativity Promotes fresh thinking and creativity Cultivates adaptability in the work culture Ignites innovative solutions Infuses forward-thinking environment with innovation My Musical Journey My Future 4 3 YEAR 3 Mid-Level Data Scientist 2 YEAR 2 Junior Data Scientist 1 YEAR 1 Entry-Level Data Scientist (Fresher) YEAR 4 Senior Data Scientist Thanks For Being A Part Of My Presentation Topic XX XX123456XXX myemailid@gmail.com My Address, Noida, India Apoorv Aggarwal Data Science Aspirant Machine Learning Deep Learning NLP Data Analytics Data Structures Python Java English Hindi

Data Science Presentation

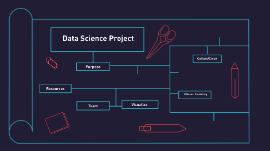
Transcript: Data Science Project Purpose Imagine you are asked to settle in a different city and you just don't have enough information about the city. What will you do, how will you choose the area that you want to live in? Description The problem statement revolves around a boy named Siddhartha. Siddhartha is a national level badminton player. Siddhartha got placed in Toronto, Canada but he's worried about his badminton career. He's not aware of the city and wants know the best area in the city so that he can also focus on his badminton as well. Let's see how our project helps him out! Objectives In order to solve the problem, we came up with our project, "The Battle of Neighbourhoods". The project divides the city in clusters on the basis of their longitude & latitude and ultimately helps you to find your ideal residential area! Collect and clean the data Analyze the data Visualize the data Collect/Clean Web Scraping using BeautifulSoup and getting coordinates using geopy Foursquare API to explore neighbourhoods Creating map and filtering data Data Collection & Cleaning The first step is to collect data and clean it. We use a technique called Web Scraping to get our data. After which we create the map of the city and filter the data. At the end, Foursquare API is used to explore neighbourhoods. KMeans Clustering KMeans clustering divides the data into K non-overlapping subsets or clusters without any cluster internal structure. It is an unsupervised algorithm. Distance of samples from each other is used to shape the clusters. There are two approaches to choose the centroids. Assign each customer to the closest center. Form a distance matrix. Iterative algorithm Not necessarily the best possible outcome. Visualize Vizualization Examining Clusters At the end, we need to visualize our findings in the best possible way. With the help of folium library, we create the map and then specify each cluster with a colour Finally, we examine each and every cluster one by one and by seeing the most common venue, we suggest the best residential area to the person. Team Manmohan SIngh Abhinav Ruhela Abhijeet Saxena We are a team of three members, and each one of us believes that learning data scince is the ultimate goal while the project is just a by-product! Resources IBM Cognitive Class IBM Cognitive Labs Towards Data Science In this project, we only consider one factor i.e. latitude and longitude of a specific area, there are other factors such as connectivity of the area and income of person that could influence the location decision of a finding a residence. However, to the best knowledge of this researcher such data are not available to the neighbourhood level required by this project. Future research could devise a methodology to estimate such data to be used in the clustering algorithm to determine the preferred locations for someone to settle in a specific city. In addition, this project made use of the free Sandbox Tier Account of Foursquare API that came 45 with limitations as to the number of API calls and results returned. Future research could make use of paid account to bypass these limitations and obtain more results. Foursquare What more can be done?

FRC Data Presentation - Template

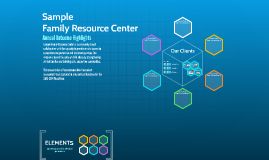
Transcript: More than two-thirds of FRC clients use Spanish as their primary language (68%). While 86% of FRC clients are Latino/Hispanic, many of them use English as their primary language. copy and paste as needed to add notes to your brainstorm Outcome Measure 2001 00,000 Approximately two out of every five FRC families use CalFresh (41%), the government subsidized food program. The share of those using CalFresh in the past few years shows the growing needs of FRC families. ELEMENTS Individuals Descriptive text detailing what the outcome measured Outcome Measure Outcome Measure Outcome Measure Families Sample Family Resource Center Sample Family Resource Center is a community-based collaborative with the capacity to provide on-site access to comprehensive prevention and treatment services. Our mission is to end the cycle of child abuse by strengthening at-risk families and building safe, supportive communities. This presentation offers outcome data from select assessment tools captured in a customized database for the 2013-2014 Fiscal Year. Descriptive text detailing what the outcome measured Outcome Measure 00,000 We served: Descriptive text detailing what the outcome measured Health Insurance 00,000 Our Clients Over 17% of Orange County residents do not have health insurance coverage (2012 ACS) compared to 28% of FRC clients who are uninsured. Half of adults are uninsured and “pay out of pocket” while the vast majority of children (80%) are covered by government health insurance programs. Family Income Outcome Measure Descriptive text detailing what the outcome measured According to the 2012 American Community Survey (ACS), the median family income in Orange County was $81,653. More than 70% of all Orange County families have an annual income over $50,000. In comparison, over 50% of FRC families make less than $15,000 annually. 17% of FRC families receive CalWorks. 2002 Descriptive text detailing what the outcome measured Children Descriptive text detailing what the outcome measured Ethnicity and Language Annual Outcome Highlights Government Food Program by age Describe the chart if needed

Data Science Presentation

Transcript: Overview Predicting Breast Cancer Survival and Treatment Outcomes Using Clinical and Genetic Data Goal: Develop predictive models for breast cancer outcomes using METABRIC dataset. Dataset: 1,980 primary breast cancer samples including demographics, tumor characteristics, treatment types, survival outcomes, mRNA expression levels, and gene mutations. Methodology: Data acquisition and preprocessing (cleansing, EDA, dimensionality reduction). Gene expression analysis to identify potential biomarkers. Machine learning algorithms: Logistic Regression, Random Forest, SVM. Focused on the top 20 genes with the most patients. Social or Ethical Implications Privacy and Data Security: Ensure protection of patient data. Ethical Use: Avoid discrimination or stigmatization based on genetic profiles. Access Disparities: Ensure equal access to personalized treatments for all patients. Informed Consent: Maintain transparency and trust with patients. Bias in Models: Address biases to ensure fair and accurate predictions for all groups. Runeem Al-Abssi, Avie Burris, Camille Anderson Findings Figures Recommendations Significant Genes: rad51c, psen2, jag1, and hdac1 correlated with breast cancer prognosis. Gene Expression Impact: Variability in gene expression levels affects survival outcomes. Treatment Response: Varied based on genetic and clinical profiles. Complex Interactions: Between gene mutations, expression levels, tumor size, and patient age. Conclusion Personalized Treatment Plans: Tailor treatments based on genetic and clinical profiles. Targeted Gene Therapy: Investigate genes like rad51c, psen2, jag1, and hdac1 for new treatments. Enhanced Predictive Models: Incorporate more genomic data and advanced algorithms. Clinical Decision Support: Use predictive models in clinical systems to aid treatment decisions. Success: Demonstrated the usefulness of machine learning in predicting breast cancer outcomes using integrated clinical and genetic data. Key Insights: Identified significant biomarkers and treatment factors to support personalized treatment strategies. Impact: Potential to enhance prognostic accuracy and advance precision medicine in oncology. Future Work: Incorporate additional genomic data and explore more advanced machine learning models to further refine predictions and improve clinical decision-making. Goal: Improve patient care and outcomes through better understanding and tailored treatment approaches.

Data Science Presentation

Transcript: Data Scientist Interview What I Learned The Basics Dr. Singh started out at The Fed Economic Research Data Cleaning Linear and Logistic Regression Went back to school and got her doctorate in data science Now works at google as a data scientist with the YouTube Comments team The Interview Interview Process 1. Screening Call with an HR Rep. to determine the best role for you (could be different than what you applied for) 2. Technical Interview to cover your general statistical and coding knowledge (there are 4 in total) 3. Behavioral interview to asses the parts of you that don't have to do with your technical ability 4. Then everything you've done so far goes through multiple committees to make sure everything's up to snuff 5. You then get to interview other hiring managers to figure out what team you want to work with Dr. Singh said the whole process took 8 week Day To Day Day to Day For Dr. Singh her job is unique in a way that her department is full of data scientists but they all work with different product segments She works primarily with the YouTube comments team where she works closely with the software engineers and product managers Her day to day mainly contains meetings with the software engineers and product managers of the YouTube comments team to determine what they need while the rest is spent coding She best describes it as being an internal consultant who does what ever they need done, small, medium, and large, when it comes to data science Languages and Technologies Commonly Used Technologies It mainly depends on what team shes working with SQL, R, Python with a little bit of C++ are all used. Data scientists don't need to know all of these but at least at google SQL is needed because its the primary way they interact their databases Its hard to get as much support for R because only 50 of the 3000 people working with YouTube are data scientists. Dr. Singh says she has a preference for R for data analysis but is trying to move towards python for the reason stated above. Knew most of the technologies going in (had to touch up on C++ and SQL) but Google has dedicated time every quarter for learning on the Job Favorite Project Favorite Project? One of her first projects The comments team had a metric they wanted to use but the data for it was extremely noisy Dr. Singh developed a method that improved the usable data by 300%. She was able to fully implement her work in a way that it was essentially plug and play for the comments team to use. It required no changes to their current codebase. The reason she enjoyed it so much was the fact that she got to use a bunch of different languages, learned a bunch of new stuff, and in the end got to wrap it up in a nice neat package that was actually useful. Current and Future Projects Recent Projects A survey after you watch a video that lets you pick between and rate 2 different comments as to which one is more relevant. Researching the correlation between Engagement signals and user satisfaction Currently working on how to detect brigaiding and notify the creator as its happening so they can disable comments and protect themselves. This involves determining what metrics are indicative of brigaiding (dislikes, mass comments, etc) Random Information Fun Facts and Random Information Her office has a slide in it to get down stairs Google hosts YTF (YouTube Fridays) where you can talk with coworkers outside of a work environment as well as talk with the YouTube CEO in a relatively relaxed environment. She also mentioned there is awesome live music. She's only had to work outside of work once and her boss was mad that it even happened at all. She said while its extremely uncommon for data science stuff to be deadline focused but it might be a little different for software engineers. "When getting your PHD you learn how to learn" Took a shotgun approach to applying for jobs (Chase Bank, Post Doc at Yale, Social Policy Think Tank, Lawrence Liver more National Lab, and many more) Advice for younger self "Stop trying to plan so much, just let go a bit, everything will be okay".

Data Science Presentation

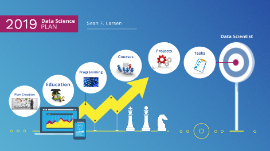
Transcript: PLAN Data Scientist 2019 Sean F. Larsen Data Science Plan Creation Plan Creation Education Programming Skills Course Projects Tasks Education Education Statistics Statistics Basics Statistics Statistical Methods Regression Analysis Probability and Distribution Theory Statistical Regression and Inference Analysis Analysis Predictive Analysis Inferential Analysis Causal Analysis Mechanistic Analysis Decision Making Data Skills Data Skills Subject Selection Data Mining Data Cleaning Data Exploration Data Presentation Data Presentation Data Visualization Story Telling With Data Programming Programming Courses Courses Projects Projects 5 Types of Data Science Projects 5 Types Importing data Joining multiple datasets Detecting missing values Detecting anomalies Imputing for missing values Data quality assurance Exploratory Data Analysis Exploratory Data Analysis Ability to formulate relevant questions for investigation Identifying trends Identifying correlation between variables Communicating results effectively using visualizations Interactive Data Visualization Interactive Visualization Including metrics relevant to your customer’s needs Creating useful features A logical layout (“F-pattern” for easy scanning) Creating an optimum refresh rate Generating reports or other automated actions Reason why you chose to use a specific machine learning model Splitting data into training/test sets Selecting the right evaluation metrics Feature engineering and selection Hyperparameter tuning Machine Learning Machine Learning Know your intended audience Present relevant visualizations Don’t crowd your slides with too much information Make sure your presentation flows well Tie results to a business impact Communication Communications First 5 Projects First 5 Continued Work Continued Work Tasks Tasks Data Science Resume Data Science LinkedIn Profile Apply for Jobs Start a Blog Update My GitHub Account Update My Pinterest Account

Now you can make any subject more engaging and memorable