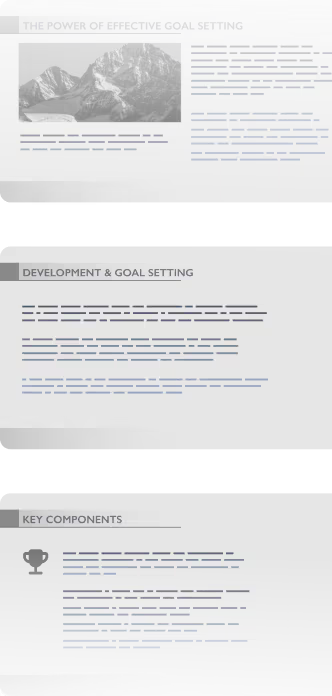
The best AI-powered alternative to PowerPoint
Create stunning presentations in seconds with Prezi AI, the AI presentation platform proven to capture attention better than PowerPoint.


How Prezi beats PowerPoint
Prezi로 더 빠르고, 더 멋진 프레젠테이션
기능


AI 생성


애니메이션


기존 프레젠테이션 업그레이드


실시간 적응력


협업


애널리틱스


모바일 앱


가격정책


이미 PowerPoint를 사용하고 계신가요? 쉽게 전환하세요. Prezi AI를 사용하면 몇 초 만에 프레젠테이션을 재구성할 수 있습니다.
Build smarter. Deliver faster.
Custom presentations made quickly
Prezi로 시작하는 것은 쉽습니다. 기존 프레젠테이션을 업로드하거나 Prezi AI에 아이디어를 입력하기만 하면 됩니다. 몇 초 만에 시각적이고, 체계적이며, 감동을 선사하는 맞춤형 프레젠테이션을 완성할 수 있습니다. 템플릿도 필요없으며 지루한 컨텐츠와 작별하세요.
Effortless creation
클릭 한 번으로 프레젠테이션을 완성할 수 있습니다. Prezi AI는 프레젠테이션 내용을 이해하고 즉시 디자인합니다. 이제 제작 시간을 줄이고 업무의 완성도를 높이는 데 더 많은 시간을 할애할 수 있습니다.
Scientifically proven engagement
Prezi는 단순히 멋지게 만드는 것에 그치지 않습니다(물론 시각적으로도 멋집니다). Prezi는 결과를 중시합니다. 대학에서 진행한 블라인드 스터디에서 Prezi는 정적인 프레젠테이션보다 25 % 더 효과적이고 22 % 더 설득력이 있는 것으로 나타났습니다. 즉, 사람들은 여러분의 말을 더욱 잘 기억할 것이고 이는 행동으로 이어질 것입니다.
Collaborate better. Present smarter.
Real-time collaboration
Prezi를 사용하면 팀원과 작업해도 속도가 줄지 않습니다. 팀 전체가 실시간으로 프레젠테이션을 함께 만들고, 편집하고, 검토할 수 있어 업데이트를 기다릴 필요도, 파일을 복잡하게 주고 받을 필요가 없습니다.
브랜드 키트
모든 프레젠테이션을 브랜드에 맞게 만드세요. Prezi의 브랜드 키트는 색상, 폰트, 로고를 고정해 두어, Prezi AI가 자동으로 제작하더라도 모든 프레젠테이션이 일관성 있고 전문적으로 보일 수 있도록 도와드립니다.
Storytelling in motion
정적인 슬라이드는 청중을 지루하게 만듭니다. 하지만 역동적인 레이아웃은 청중을 끌어들이고 자연스럽게 여러 아이디어를 넘나들 수 있도록 도와줍니다. 청중이 보고 싶어 하는 내용을 바로 보여주세요. 청중이 진정으로 기억하는 프레젠테이션을 만들어 보세요.
파워포인트 사용자가 Prezi로 전환하는 이유
지금까지 여러 프레젠테이션 도구를 사용해 봤지만, Prezi는 단연 최고입니다. Prezi만의 독특한 확대/축소 기능과 역동적인 레이아웃 덕분에 프레젠테이션이 시각적으로 매력적이고 기존 슬라이드보다 훨씬 기억에 남습니다.
동료 선생님께 Prezi AI의 기능을 보여드렸을 때 정말 감동했어요. 몇 마디만 입력하면 쇼 전체를 디자인해 주더라고요. 수정이 필요한 부분만 편집하고 추가할 부분은 추가했어요. 더욱 인상 깊은 수업을 계획할 때 자주 사용할 생각입니다.
10년 전에 파워포인트에서 Prezi로 전환한 후, 저는 한 번도 후회한 적이 없습니다! 교사로서 Prezi는 제 교실에 없어서는 안 될 도구가 되었고, 수업은 더욱 흥미롭고 학생들의 참여는 높아졌습니다.
아직도 파워포인트를 사용하시나요? 놓치고 계신 점이 있어요.
템플릿과 지루한 슬라이드에 시간 낭비하지 마세요. Prezi AI는 탁월한 속도와 효과로 프레젠테이션을 제작하고, 디자인하고, 발표할 수 있도록 도와드립니다. 과학적 근거를 바탕으로 수백만 명의 신뢰를 얻고 있습니다.


자주 묻는 질문
파워포인트 자료를 Prezi로 불러오고 내보낼 수 있나요?
Yes! Upload any existing presentation as a PPTX, PDF, or DOCX file and Prezi AI will automatically rebuild your presentation with a fresh, dynamic design. You can export any presentation from Prezi as a PowerPoint file, too.
파워포인트 프레젠테이션에 가장 적합한 AI는 무엇인가요?
Prezi AI is trained on the largest public presentation library available and refined by our team of presentation designers. That means an AI presentation maker that knows how to make great decks, even if you need them as a PowerPoint.
무료 파워포인트 생성기가 있나요?
Yes. With Prezi, you can make your presentation with all of our upgrades and then export your work as a PowerPoint file. That means all the benefits of Prezi, converted into the file type you need.
수업 시간에 Prezi AI가 파워포인트 AI보다 나은 점은 무엇인가요?
Definitely. Educators around the world love Prezi because it does a better job keeping your students interested and makes complex ideas easy to follow. We’ve even got a special plan for educators like you.
팀원들과 함께 Prezi를 사용할 수 있나요?
Yes! Prezi is built for collaboration. You and your team can create, edit, and present together in real time from anywhere. It’s easy to add comments, make live updates, and stay in sync without needing to send endless presentation versions to each other.


