Prezi AIでより速く作業
アイデアからプレゼンテーションまで数秒で変換します
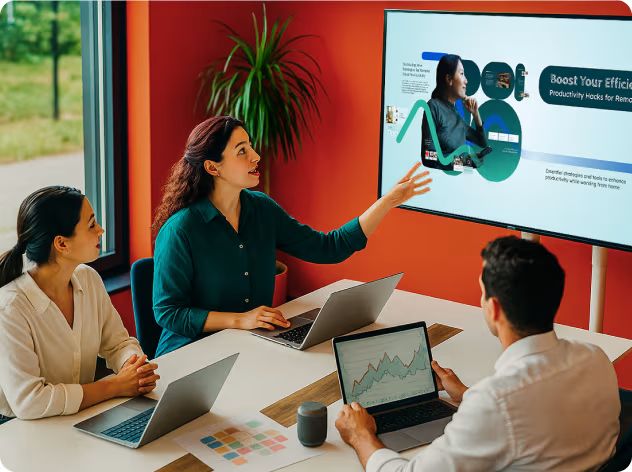
ツール、トレンド、実用的なヒントを活用して、リモートチーム向けのスマートで魅力的なトレーニング セッションを構築します。
新鮮な食材と斬新なアイデアを盛り込んだ、メキシコ料理のフードトラックのコンセプトを提案します。明確な成長計画と魅力的なビジュアルも添えてください。
最近のKPI、市場動向、次なる展開に焦点を当てた、テックブランドのクリエイティブなマーケティング戦略を紹介します。
金融機関向けに、主要な成功、トレンド、新規顧客へのチャンスを強調したデータ主導のセールス ピッチを作成します。
パフォーマンス指標と戦略を分析して、健全な開発ビジネスレビューを行います。大胆なビジュアル、グラフ、明確なポイントで今後の展望を予測します。

4/5
Preziの方が聴衆の注意を引くのに効果的だと言っています。

4人中3人が
同僚に Prezi を勧めます。

91%が
Prezi によって仕事の成果が確実に向上したと回答しています。
優れたプレゼンの力を熟知している組織から信頼されています


トップパフォーマーが Prezi を選ぶ理由
プレゼンテーション資料の作成時間を短縮
アイデア、アウトライン、プレゼンテーション資料を、わずか数秒で洗練されたプレゼンテーションに変換。締め切りに遅れず、迅速に成果を上げましょう。
PPTX、PDF、DOCXのインポート
既存のファイルをインポートして、すぐに作業を開始。かつてないほど簡単に作品を変換できます。
数秒でカスタムプレゼンを作成
アイデアを説明すれば、Prezi AIが数秒でアウトラインとプレゼンテーションをデザインします。すべてあなたの手によってコントロールできます。
スライド一つ一つで会場を魅了
デザインスキルは不要。まるでプロのデザイナーのように、魅力的なプレゼンテーションを作成できます。Prezi なら、あなたの仕事にぴったりの魅力的なプレゼンテーションを作成できます。
ブランドをアピール
ロゴをアップロードすると、Prezi AI がブランドに合ったカラーパレットを自動的に作成し、すぐに適用できます。
デザイナーをそばに
ワンクリックでデザインが提案されるので、どの選択も最適なものになります。さらに、AIによるテキスト改善機能で、より魅力的なメッセージを作成できます。
他と差をつける
Prezi Video を使用して、いつでもどこからでもあなたとあなたのコンテンツを披露。バーチャル、ハイブリッド、または録画プレゼンテーションに最適です。
あなたの画像とコンテンツが画面上に同時に表示
お気に入りのビデオ会議ツールでコンテンツを披露。
プレゼンを録画
動画ファイルをダウンロードして簡単に保存・共有。
ユーザーから愛される理由
Preziは、何百もの高評価なカスタマーレビューに基づき、業界を超えて注目を集めるプレゼンのリーダーとして評価されています。


オーディエンスの声
「Prezi は、従来のスライドベースのプレゼンテーションに代わる素晴らしい選択肢です。」
私の会社で、標準のPowerPointではなく Prezi を採用して以来、トレーニングや販売デモを作成したときの反応が圧倒的に好評です。
「Prezi AIを使うことで時間を大幅に節約し、見た目もプロフェッショナルにできました。」
「他とは違い、プロフェッショナルで記憶に残るプレゼンテーションを作れます。いつもどのプラットフォームを使っているのか聞かれます。」
「Preziは、従来のスライド資料と比較して、人々の注目を集めます。」
「これは、他の人より一歩リードし、プロフェッショナルに見せ、アイデアを際立たせるためのツールです。」

プレゼンタービュー
ノート、便利なタイマー、進行を管理するためのキューをすばやく確認できます。

利用統計を見る
視聴者の共感を得ている内容と、各スライドに費やした時間を確認できます。

削除可能なシェアリンク
個別リンクでプレゼンをシェア。リンクはいつでも無効にできます。

SOC2準拠
セキュリティに重点を置き、皆様のデータを安全に保ちます。
プライバシーコントロール
簡単に追跡できるシェア設定で、プレゼンを閲覧、編集、コメントできるユーザーを管理できます。

オフラインで作業
Prezi for Desktopアプリを使えば、どこからでも編集してプレゼンできます。
チームや部署全体をコントロール
マーケティング、コンサルティング、営業、研修、人事など、チームメンバー全員が、際立ったコンテンツを作成するために必要なビジネス プレゼンテーションツールを活用。Prezi for Business なら、メンバー全員の注目を集め、ブランドを反映し、成果を出すプレゼンテーションを作成・配信できます。
1億6000万人以上のユーザーに参加して、より良いプレゼンをしよう

よくある質問
ビジネスユーザーとしてPreziアカウントにアクセスするにはどうすればよいですか?
Log in at prezi.com/login. Once logged in, you'll have access to all Prezi Business features, including Prezi AI, advanced analytics, and brand controls, making it easy to create business presentations with AI.
Prezi AIをビジネスプレゼンの作成にどのように活用できますか?
AI transforms your ideas into presentations in seconds. Simply upload a file (like a PDF or Word doc) or provide a short prompt describing what you need, and Prezi AI generates a customized presentation with a design tailored to your content. You can review and edit the outline before Prezi generates the full presentation, so you stay in control every step of the way.
Prezi Presentのプレゼン例はどこで見つけられますか?
Check out our AI prompt library for inspiration on how to quickly generate presentations for specific business needs.
Prezi AIはピッチデック、営業資料、またはビジネス提案書を作成できますか?
Yes. Prezi AI can help you create a pitch deck with AI, generate a sales deck, or build a business proposal presentation quickly. It works as an AI pitch deck generator, AI slide deck generator, and AI business proposal generator — giving you a strong starting point you can edit and refine.
Preziはビジネスチームにとって優れたAIピッチデックジェネレーターですか?
Prezi is built for business teams that need fast, polished decks. If you’re looking for the best AI pitch deck generator or AI pitch deck builder for client-ready presentations, Prezi AI helps you go from idea to presentation in minutes.
プレゼンの分析データを表示するにはどうすればよいですか?
Prezi Analytics lets you track engagement and get detailed stats on all your presentations. After you share your presentation link, you can view detailed engagement and viewer stats in Prezi Analytics.
Preziでブランドを維持するにはどうすればよいですか?
Prezi makes brand consistency effortless. Upload your logo, and Prezi automatically creates custom color palettes that match your brand. You can instantly apply these palettes to any presentation, ensuring your team's content always reflects your company's visual identity.
Preziでチームを作成するにはどうすればよいですか?
Contact our sales team if you’re interested in setting up an account with multiple team members . Teams can work together on presentations, add comments on frames for feedback and discussion, share presentations via link or through your team workspace, and maintain brand consistency with shared brand kits and templates. Prezi is SOC 2 Type 2 certified, which means your team's presentations and data are protected with enterprise-level security.